
আরও দেখুন


 24.07.2026 10:37 AM
On the hourly chart, GBP/USD rebounded on Thursday from the 38.2% Fibonacci retracement level at 1.3397, based on the updated Fibonacci grid, and declined toward the 61.8% Fibonacci level at 1.3298. Today, a rebound from this level would favor the British pound and a moderate recovery toward 1.3348 and 1.3397. A consolidation below 1.3298 would increase the likelihood of a further decline toward 1.3238 and 1.3177.
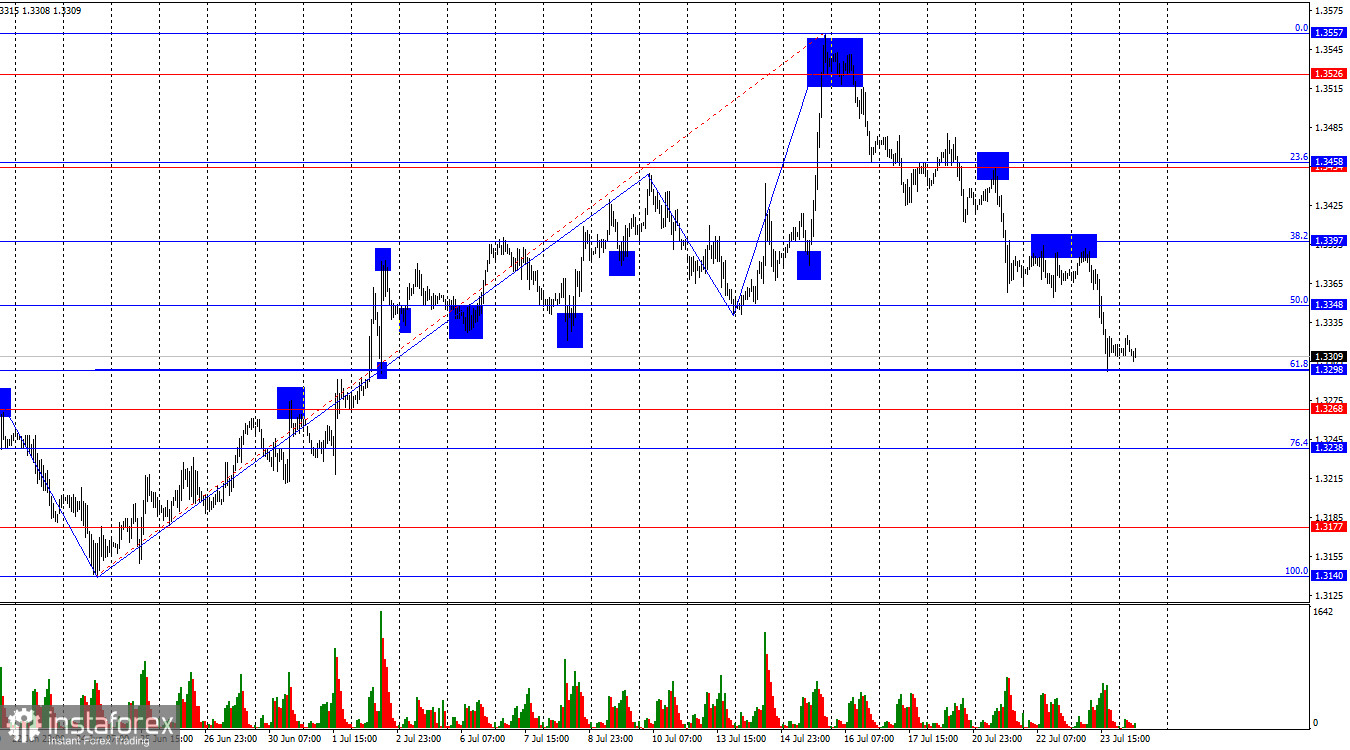
The wave structure has shifted to a bearish outlook. The most recently completed upward wave exceeded the previous peak, while the new downward wave broke below the previous low. As a result, the bears have regained control of the market. In my view, the bearish impulse that dominated in 2026 has run its course, and only geopolitical developments can prevent the bulls from resuming their advance. At present, geopolitical tensions are once again weighing on risk-sensitive assets.
Thursday's news backdrop was not negative for the pound. While the previous day's UK inflation data could indeed have encouraged renewed selling pressure, there were no new reasons on Thursday for the bears to extend their attack. There were no significant economic releases in either the UK or the United States, and the ECB meeting should not have triggered a decline even in the euro, let alone in the pound sterling. Therefore, the pound's decline reflected the bears' determination to break the bullish trend, reinforced by geopolitical tensions that continue to point to one conclusion: the conflict in the Middle East is likely to be not only prolonged but also to spread geographically. Yemen has already become involved, with the Houthis disrupting Saudi shipping in the Red Sea. It cannot be ruled out that U.S. allies may soon launch strikes against Houthi positions as well. The international community has no interest in allowing two strategically important maritime chokepoints in the Middle East to become blocked.
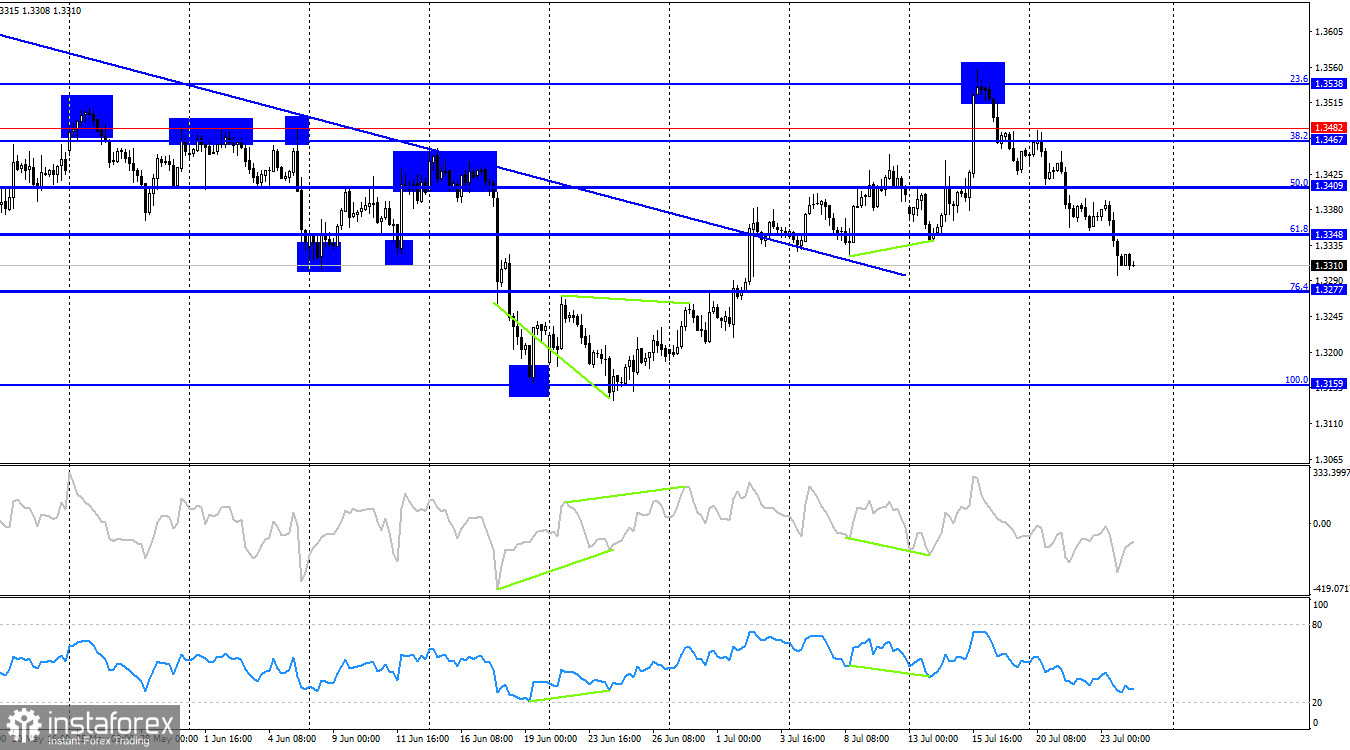
On the 4-hour chart, GBP/USD rebounded from the 23.6% Fibonacci retracement level at 1.3538, reversed in favor of the U.S. dollar, and continues to decline toward the 76.4% Fibonacci level at 1.3277. A consolidation below 1.3277 would increase the probability of a continued decline. No emerging divergences are currently visible on any of the technical indicators.
Commitments of Traders (COT) Report:
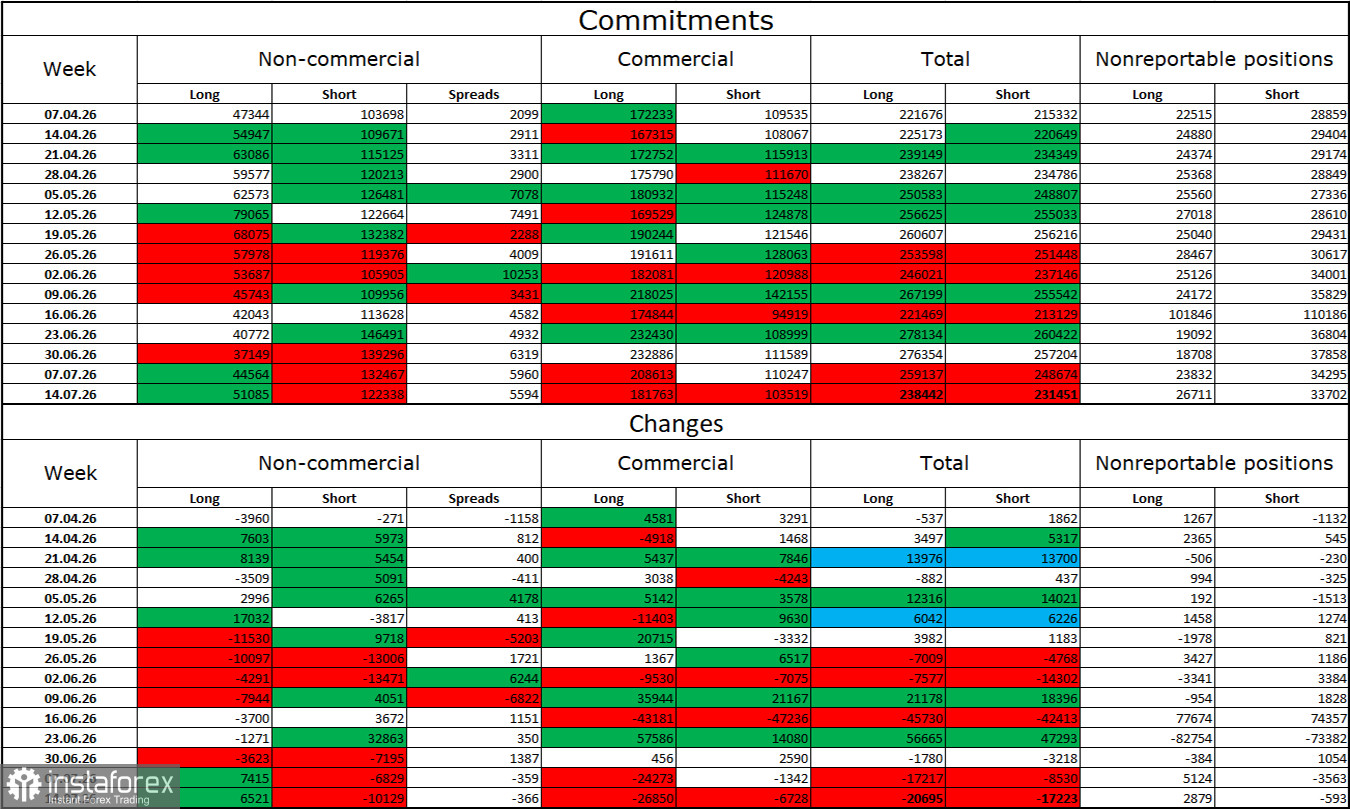
The sentiment among the Non-commercial group became less bearish during the latest reporting week, although it remains bearish overall. The number of long positions held by speculative traders increased by 6,521, while short positions decreased by 10,129. The current balance stands at approximately 51,000 long positions versus 122,000 short positions. Bears have dominated the market for several months. However, unlike before, this dominance is now being called into question as the broader fundamental backdrop has changed.
I still do not believe in a sustained bearish trend for the pound. However, in the near term, market direction will depend less on economic data, Trump's trade policy, or central bank monetary policy than on the duration, scale, and consequences of the conflict in the Middle East. In recent weeks, the market had shifted toward expectations of peace, but negotiations between Iran and the United States collapsed before they had meaningfully begun. There is also no guarantee that they will resume in the near future.
Economic Calendar
United Kingdom
United States
The economic calendar for July 24 includes several notable releases, with the UK reports being the most significant. Economic data may influence market sentiment throughout Friday, although the overall impact is unlikely to be particularly strong.
GBP/USD Forecast and Trading Tips
Short positions were justified following the rebound from the 1.3397 level on the hourly chart, with downward targets at 1.3348 and 1.3298. Both targets have now been reached. Additional short positions may be considered after a confirmed close below 1.3298, targeting 1.3238 and 1.3177. Long positions may be considered following a rebound from 1.3298, with upside targets at 1.3348 and 1.3397.
The Fibonacci levels are drawn from 1.3140 to 1.3557 on the hourly chart and from 1.3158 to 1.3655 on the 4-hour chart.


