See also

 19.11.2025 10:39 AM
Trend Analysis (Fig. 1).
On Wednesday, the market may begin moving upward from the 1.3141 level (yesterday's daily candle close), targeting 1.3194 — the 21-period EMA (thin black line). When testing this line, the price may pull back downward toward 1.3178 — the 23.6% retracement level (blue dashed line).
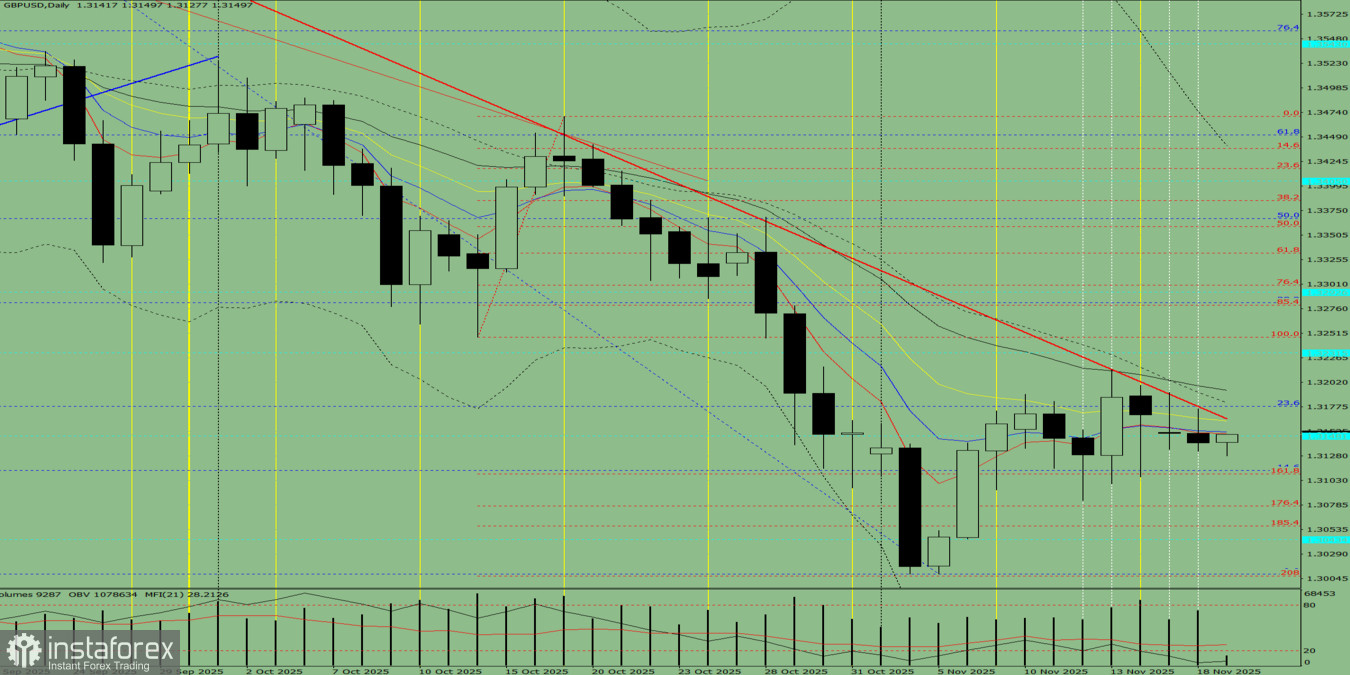
Figure 1 (daily chart).
Comprehensive Analysis:
Overall conclusion: an upward trend.
Alternative scenario: On Wednesday, the market may begin moving upward from the 1.3141 level (yesterday's daily candle close), targeting 1.3232 — a historical resistance level (blue dashed line). When testing this line, the price may pull back downward toward 1.3194 — the 21-period EMA (thin black line).
You have already liked this post today
*The market analysis posted here is meant to increase your awareness, but not to give instructions to make a trade.


