यह भी देखें

 16.12.2025 06:34 AM
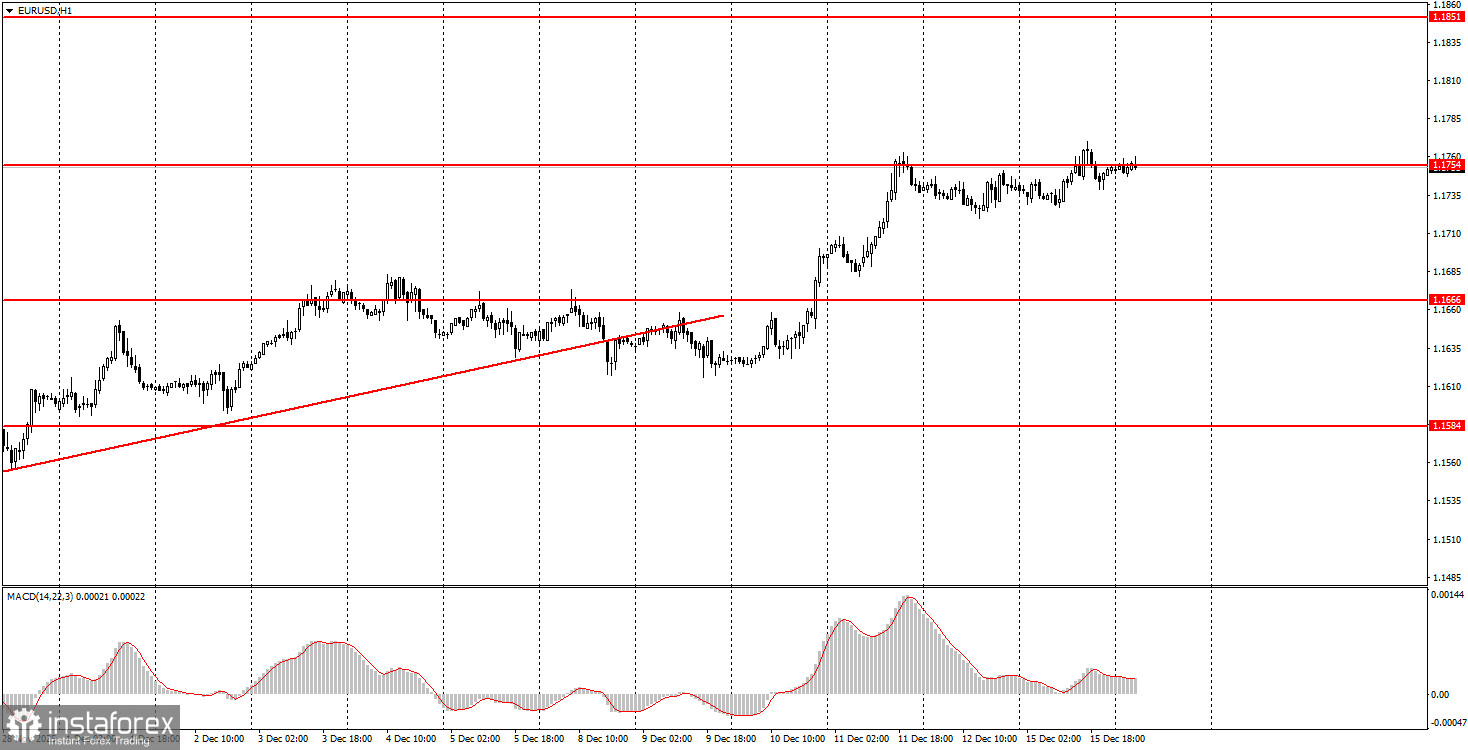
The EUR/USD currency pair traded very weakly on Monday. The macroeconomic background was almost non-existent that day, so it is not surprising that volatility was extremely low. Nevertheless, the upward trend remains, and in the course of the current week, anything can be expected from the pair. It's important to note that today marks the start of release of key macroeconomic data in the EU, the UK, and the US. While European reports are interesting, they are not super important; the US reports could trigger an "atomic bomb explosion" in the currency market. Of course, the Non-Farm Payroll and unemployment reports could turn out to be "bland," but we believe that even "bland" reports could provoke significant market movements, simply because the market has been waiting for them for over two months. Thus, the movements of the pair today will depend not on technical trends or trading signals, but on the macroeconomic backdrop, which will unfold in stages throughout the day.
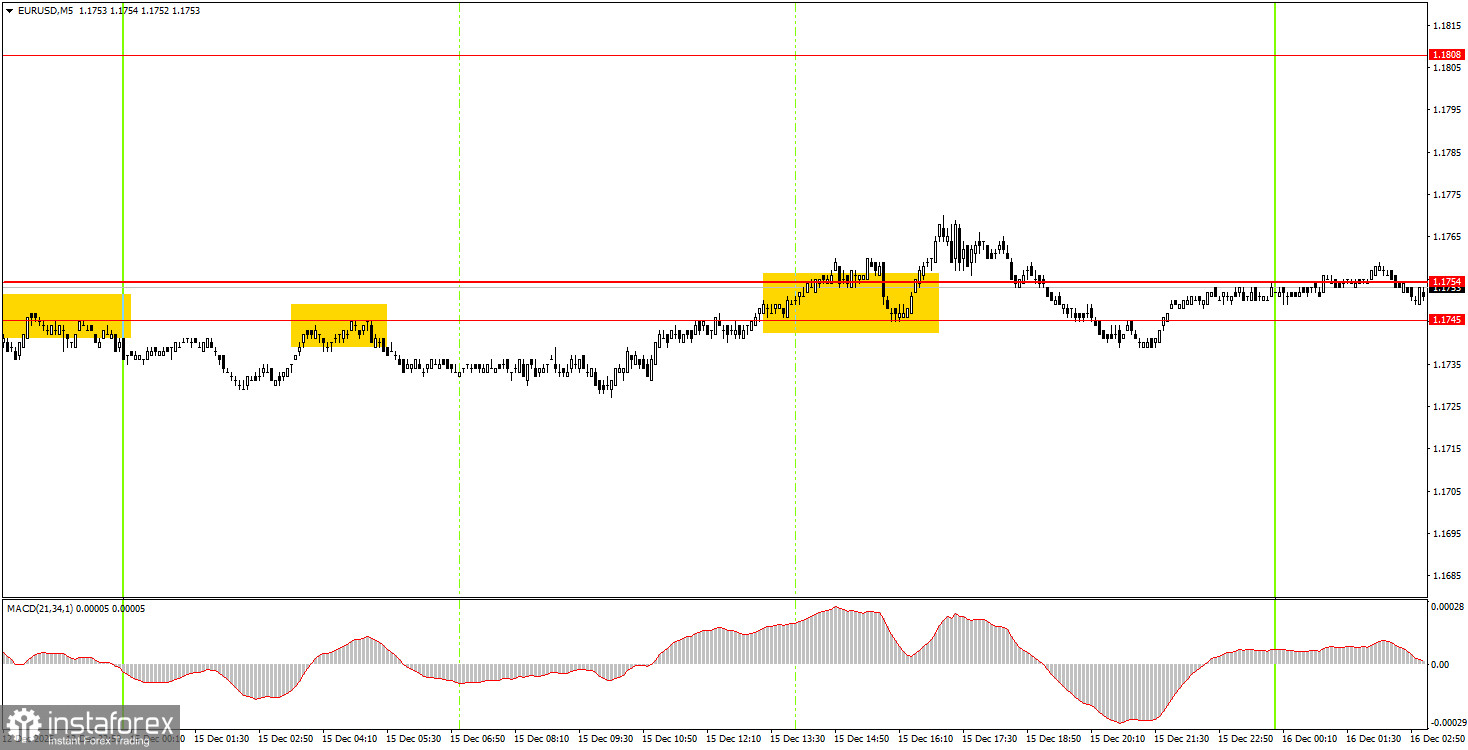
On the 5-minute timeframe on Monday, two trading signals were formed, but again, the movements were weak, making it pointless to act on them. The first signal formed during the night, and the second during the US trading session, when it was already clear that we would not see any interesting movements. Today, signals may continue to form in the area of 1.1745-1.1754, but throughout the day, amid macroeconomic reports, traders may see sharp, non-technical price reversals.
On the hourly timeframe, the EUR/USD pair continues to form an upward trend, even though the price crossed the trend line last week. The fundamental and macroeconomic background remains very weak for the US dollar; thus, we expect further gains for the pair. Even technical factors currently support the euro, as the flat on the daily timeframe persists, and after a reversal around the lower boundary, it is reasonable to expect growth towards the upper boundary.
On Tuesday, novice traders can again trade from the area of 1.1745-1.1754. A new bounce from this area to the downside will allow for the opening of short positions targeting 1.1655-1.1666. A breakout above this area will indicate long positions with a target of 1.1808.
On the 5-minute timeframe, key levels to consider are 1.1354-1.1363, 1.1413, 1.1455-1.1474, 1.1527-1.1531, 1.1550, 1.1584-1.1591, 1.1655-1.1666, 1.1745-1.1754, 1.1808, 1.1851, 1.1908, and 1.1970-1.1988. On Tuesday, important reports on business activity indices and economic sentiment indices are scheduled for release in the Eurozone. In the US, the Non-Farm Payrolls, unemployment rate, ADP report, and business activity indices in both the services and manufacturing sectors will be published.
Important Note: Significant speeches and reports (always included in the news calendar) can greatly influence the movement of the currency pair. Therefore, during their release, it is advisable to trade cautiously or exit the market to avoid sharp reversals against the preceding movement.
Remember: For beginners trading in the Forex market, it is important to understand that not every trade can be profitable. Developing a clear strategy and practicing money management are keys to long-term trading success.

