یہ بھی دیکھیں

 20.11.2025 10:24 AM
Trend Analysis (Fig. 1)
On Thursday, the market may begin moving upward from the 1.3055 level (yesterday's daily candle close), targeting 1.3077 — the 176.4% target level (red dotted line). From this level, the price may possibly pull back downward, aiming for 1.3057 — the 185.4% target level (red dotted line).
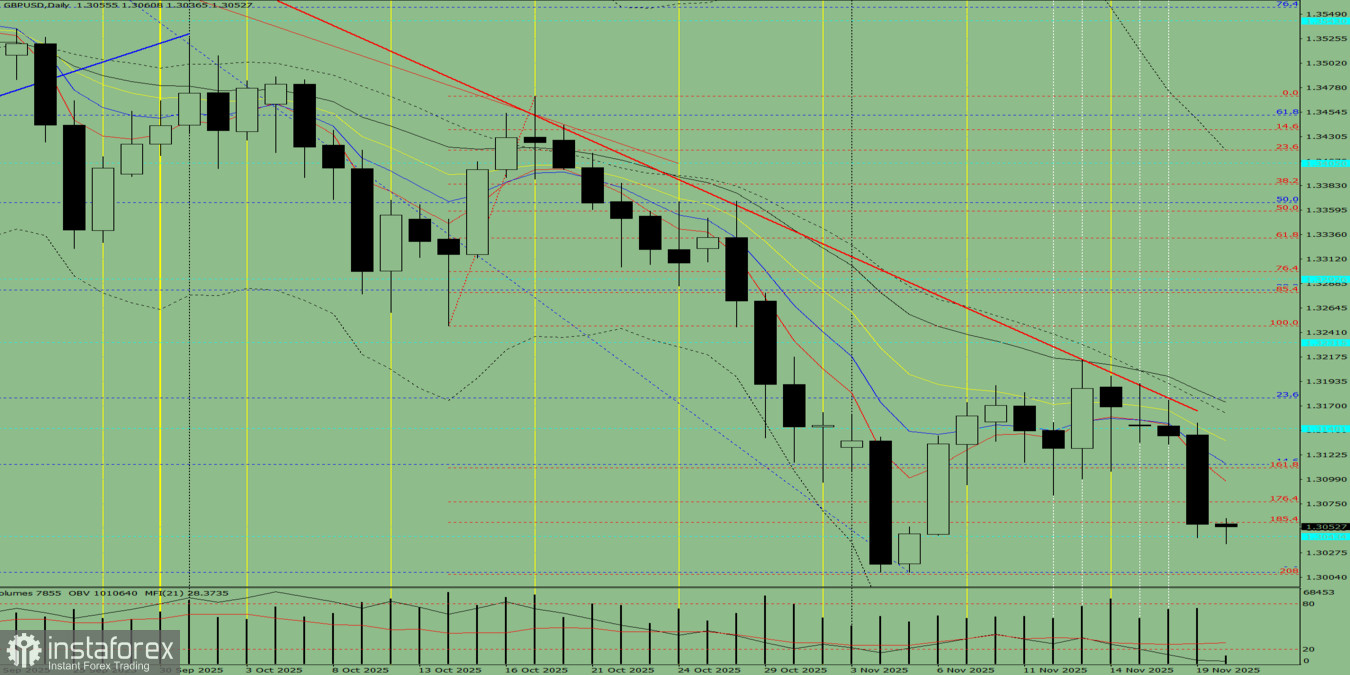
Fig. 1 (Daily Chart)
Comprehensive Analysis:
Overall conclusion: upward trend.
Alternative scenario: From the 1.3055 level (yesterday's daily candle close), the price may continue moving downward, targeting 1.3043 — the historical support level (light blue dotted line). From this level, the price may possibly bounce upward, targeting 1.3077 — the 176.4% target level (red dotted line).
You have already liked this post today
*تعینات کیا مراد ہے مارکیٹ کے تجزیات یہاں ارسال کیے جاتے ہیں جس کا مقصد آپ کی بیداری بڑھانا ہے، لیکن تجارت کرنے کے لئے ہدایات دینا نہیں.


