یہ بھی دیکھیں

 24.12.2025 08:51 AM
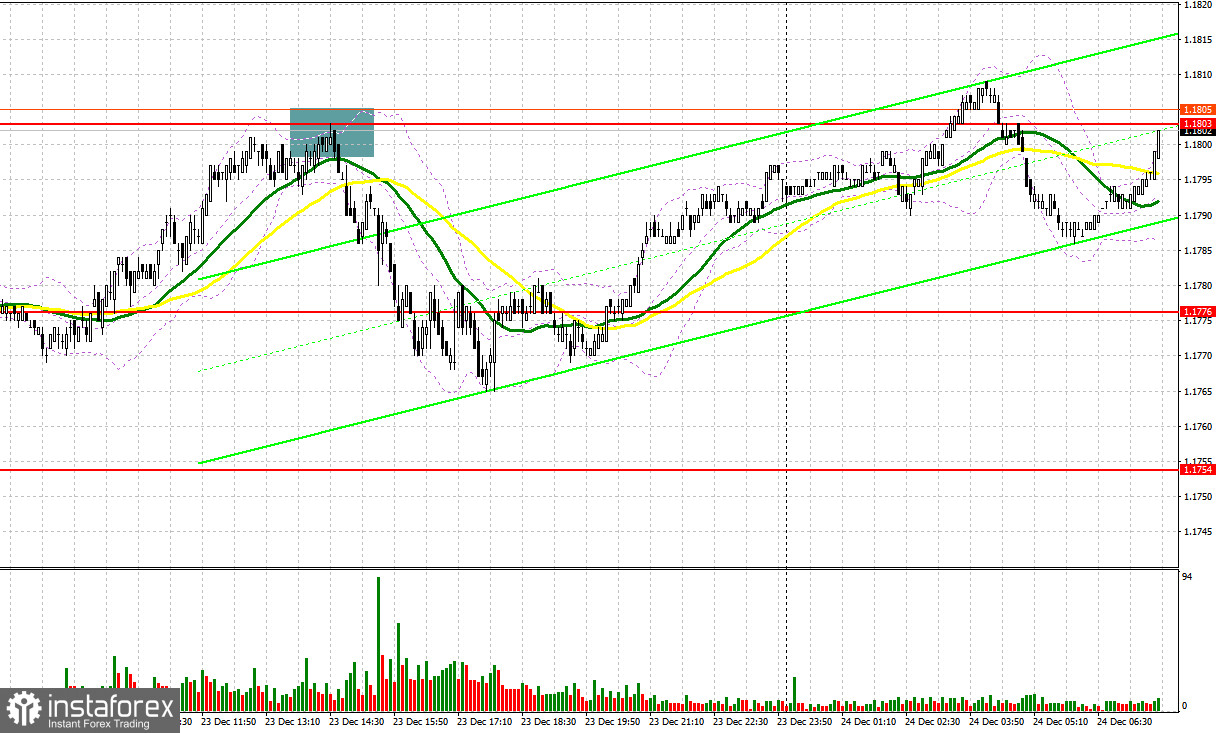
Yesterday, only one entry point into the market was formed. Let's take a look at the 5-minute chart and analyze what happened. In my morning forecast, I focused on the 1.1776 level and planned to make decisions based on it. The breakout at 1.1776 occurred, but there was no retest, which meant I missed the opportunity to buy the euro. In the second half of the day, bears appeared around 1.1802, providing a good entry point to sell the euro, which led to a move of more than 30 pips.
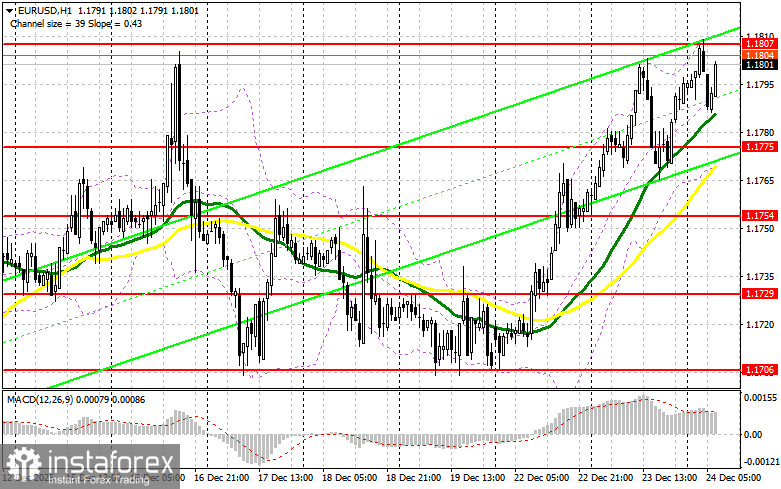
The US dollar reacted yesterday with a temporary strengthening to news that the US economy posted the fastest growth in two years in the third quarter, supported by steady consumer and business spending. According to the data, the inflation-adjusted gross domestic product grew by 4.3% year-on-year, exceeding all forecasts. However, dollar buyers failed to defend their positions, resulting in another increase in the EUR/USD pair by the close of the US session. Today, there is little data from the Eurozone, so the pair may continue its upward trend. If there is a slight decline in EUR/USD during the correction, I expect to see the first signs of buyers around the support level at 1.1775, as formed by yesterday's trading. Only after a false breakout there can we get an entry point for long positions, targeting recovery towards the resistance at 1.1807, where trading is currently taking place. A breakout and retest of this range, as discussed above, will confirm the appropriate actions for buying euros with expectations of a larger rally to 1.1840. The furthest target will be the 1.1882 area, where I plan to take profits. If EUR/USD declines and there is no buying at 1.1775, pressure on the pair will increase, potentially driving it towards the next support level at 1.1754. Only a false breakout there would be a suitable condition for buying euros. I plan to buy EUR/USD immediately on a bounce from the low of 1.1729, targeting an intraday correction of 30-35 pips.
Sellers of the pound showed some activity yesterday but could not maintain control of the market, even amid robust reports indicating the continued development of the bullish trend. For this reason, caution should be exercised when considering short positions. If the pair continues to rise, bears may be expected around the 1.1807 resistance level. A false breakout there will provide an opportunity to sell EUR/USD, targeting a decline towards the support level of 1.1775, where moving averages support the bulls. A breakout and retest from below this range after weak data will deliver a more significant blow to buyers' positions, resulting in the triggering of stop orders and opening the pathway to 1.1754. The furthest target will be the 1.1729 area, where I will take profits. If EUR/USD continues to rise and bears do not act at 1.1807, buyers will have a good opportunity to extend the bullish market. In that case, short positions should be delayed until the larger level of 1.1840. Selling there will only occur after a failed consolidation. I plan to open short positions immediately on a bounce from 1.1882, targeting a 30-35-pip downward correction.
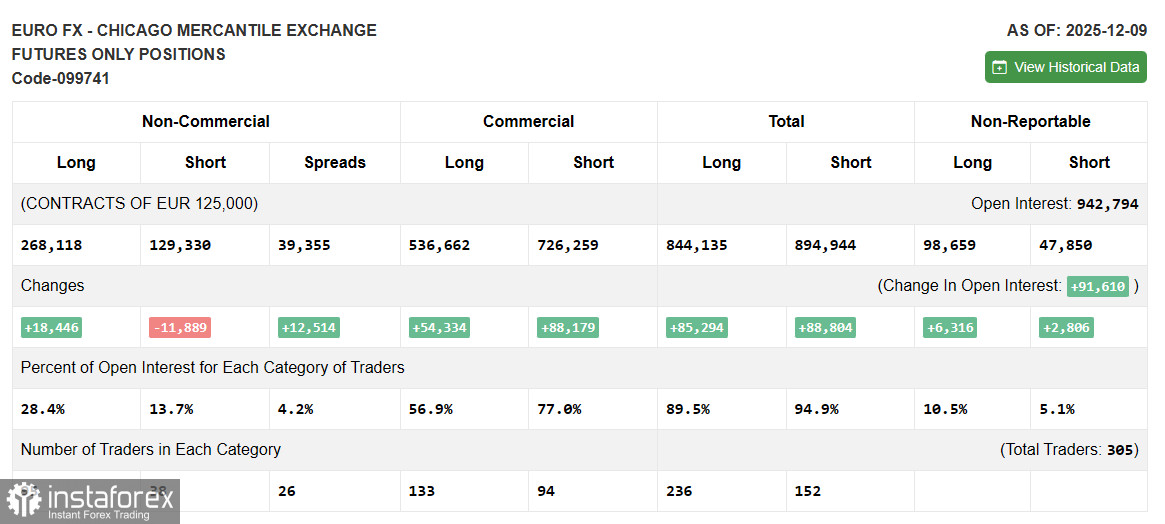
Due to the shutdown in the US, fresh data on the Commitment of Traders (COT) is not being published. As soon as the current report is prepared, we will publish it immediately. The latest available data is only from December 9.
In the COT report (Commitment of Traders), there was an increase in long positions and a decrease in short positions. However, for strategy development, this data is not applicable and therefore does not require special attention. The COT report indicates that long non-commercial positions rose by 18,446 to 268,118, while short non-commercial positions decreased by 11,889 to 129,330. As a result, the spread between long and short positions increased by 12,889.