empty
 
 
06.04.2026 07:29 AM
What To Pay Attention To On April 6? Analysis Of Fundamental Events For Beginners

Analysis Of Macroeconomic Reports:

This image is no longer relevant

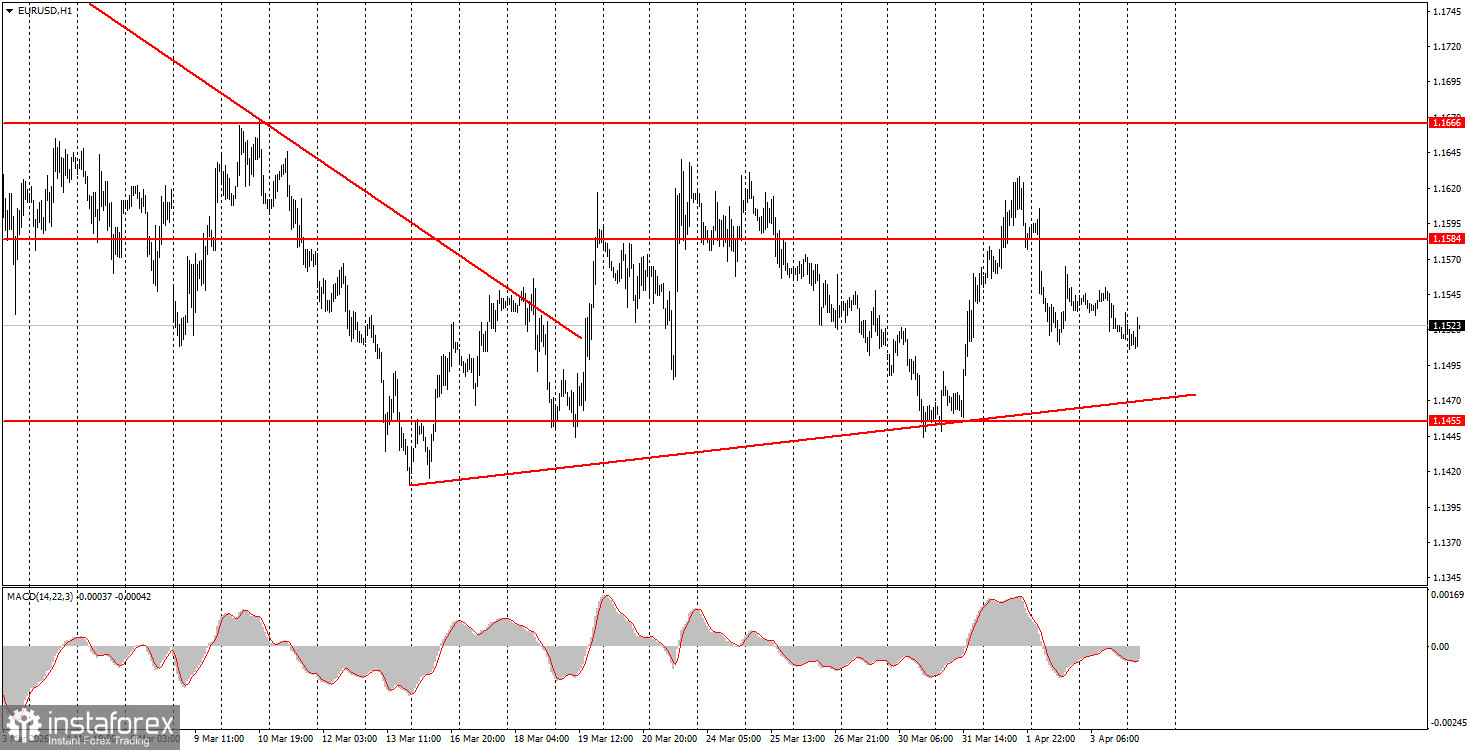
There are very few macroeconomic reports scheduled for Monday. Essentially, the only notable release is the ISM Services Index for the US for March. Regardless of what this index shows, the market continues to ignore almost all macroeconomic background. Friday proved once again to traders that this is the case.

Analysis Of Fundamental Events:

This image is no longer relevant

There is absolutely nothing significant to note among the fundamental events for Monday. But it is also unnecessary. The market continues to ignore all factors unrelated to geopolitics. Last night, Donald Trump once again issued threats towards Iran, reminding that on Tuesday, the US may launch a new strike against the country if Tehran does not unblock the Strait of Hormuz and sign a deal with the US. Given that Iranian officials have stopped even commenting on Trump's outbursts, we assume that Iran is preparing for a strike on its territory and a retaliatory strike against the adversary. Everyone understands the events that this will lead to.

General Conclusions:

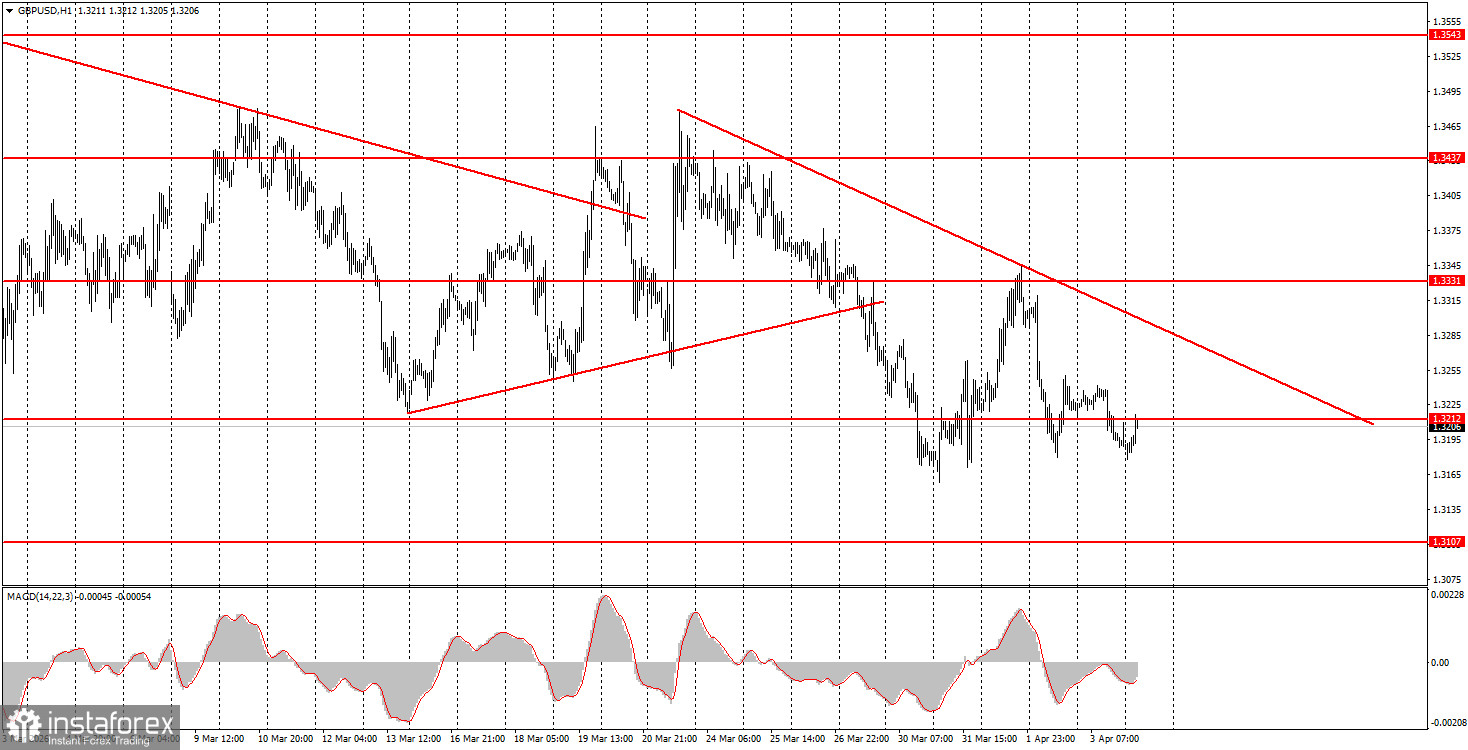
During the first trading day of the week, both currency pairs may trade in either direction, as the market continues to react solely to geopolitical news that cannot be predicted. The euro can be traded today in the range of 1.1527-1.1531, while the British pound can be traded in the range of 1.3203-1.3212. We still do not see grounds for strong and sustained growth in the US currency (considering all factors, not just geopolitics), but in the near future, geopolitics will remain the key factor in the currency market.

Key Principles of the Trading System:

  1. The strength of the signal is determined by the time it took to form the signal (bounce or level breakthrough). The shorter the time, the stronger the signal.
  2. If two or more trades were opened around any level based on false signals, all subsequent signals from that level should be ignored.
  3. In a range, any pair can generate a lot of false signals or may not generate them at all. Technical levels may be ignored.
  4. On the hourly timeframe, it is advisable to trade signals from the MACD indicator only when there is good volatility and a trend that is confirmed by a trendline or trend channel.
  5. If two levels are located too close together (5-20 pips apart), they should be considered a support or resistance area.
  6. After moving 15 pips in the correct direction, a Stop Loss should be set to breakeven.

What to Look for on the Charts:

Price levels of support and resistance are levels that serve as targets when opening buys or sells. Take Profit levels can be placed around them.

Red lines represent channels or trend lines that show the current trend and indicate the direction in which it is preferable to trade now.

The MACD indicator (14,22,3) – the histogram and the signal line – is a supporting indicator that can also be used as a source of signals.

Important speeches and reports (always included in the news calendar) can significantly affect the movement of the currency pair. Therefore, during their release, trading should be done with utmost caution, or traders should exit the market to avoid sharp price reversals against the previous movement.

Beginning traders in the forex market should remember that not every trade can be profitable. Developing a clear strategy and effective money management are the keys to long-term trading success.

Recommended Stories

ابھی فوری بات نہیں کرسکتے ؟
اپنا سوال پوچھیں بذریعہ چیٹ.