
یہ بھی دیکھیں


 13.08.2026 08:49 AM
The crypto market is showing a paradoxical picture in response to seemingly positive news. July's core CPI printed exactly at the 2.5% consensus, and US stock indices hit record highs, yet Bitcoin extended its weakness. That is a worrying signal — a muted reaction to good news is viewed as a warning. The BTC price is pinned between two key bands: the realized average price around $63,000 below and the short-term holders' cost basis near $68,700 above. The narrowing of these two levels is taking place against a backdrop of compressing volatility for almost three months straight.
The most telling indicator of market exhaustion has been spot trading volume, which has fallen to the lowest level in the observation period since early 2019. Trading activity is approaching the levels seen in the 2023 bear market. Glassnode's report explicitly notes that such a thin market can amplify any subsequent large move, because with few participants and low liquidity, even moderate buying or selling pressure can have a disproportionately large impact on price.
The structural reason for the market's thinning lies not in Bitcoin itself but in competing yields from traditional assets. Three-month Bitcoin futures yields have remained below the yield on two-year US Treasuries since February — only the second time this has happened in the observation history — making the classic carry strategy noticeably less attractive and prompting institutional investors to shift capital into cash and government bonds instead of Bitcoin. That explains weak ETF inflows and muted deposit and withdrawal activity on exchanges.
The report nonetheless recognizes a dual picture rather than an unequivocally bearish signal. Sellers are gradually running out of steam, the share of supply in profit is approaching past bear-market-bottom territory, and the breakeven level has rejected recovery attempts nine times, showing persistent resistance on the way up.
At the same time, buyers are practically absent, ETF inflows are minimal, coins continue to flow onto exchanges, and leverage in the derivatives market has already tilted toward longs on top of thinning buy-side demand — creating the risk of cascade liquidations on the slightest downward move, as has repeatedly occurred this year.
Trading recommendations
Bitcoin
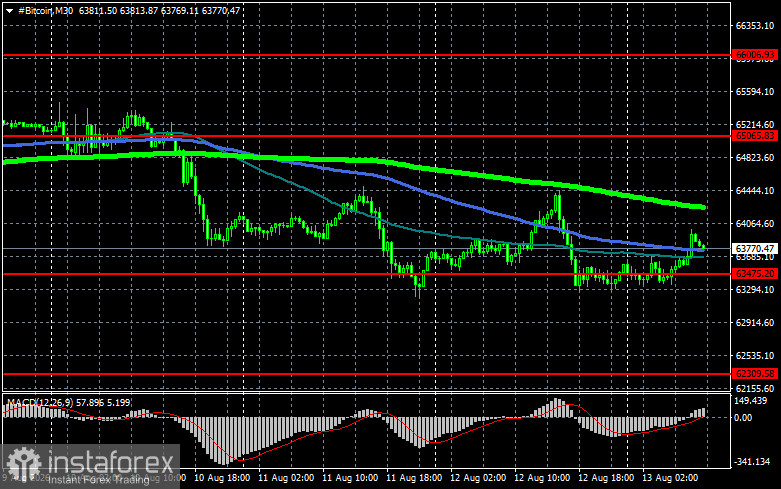
Buyers are currently targeting a return to $65,000, which would open a direct path to $66,000 and then toward $66,800 — a break above that level would signal attempts to restore a bull market. On the downside, buyers are expected at $63,400. A move back below that area could quickly push BTC toward $62,300. The most distant target would be around $60,600.
Ethereum
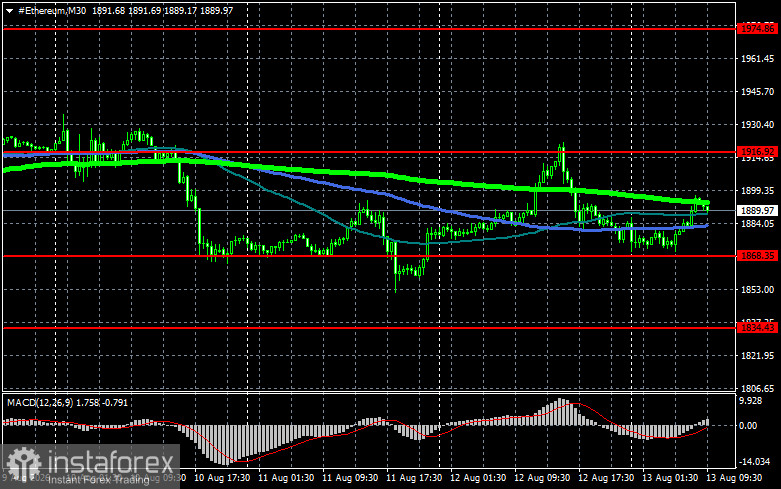
A clear hold above $1,916 would open a direct path to $1,974. The furthest target would be the high around $2,012; a break above that would indicate strengthening bullish sentiment and a return of buyer interest. On the downside, buyers are expected at $1,868. A move back below that area could quickly push ETH toward $1,834. The most distant target would be around $1,782.
What's on the chart
Price testing or crossing any of these moving averages often either halts movement or injects fresh momentum into the market.


