Vea también

 10.12.2025 07:17 AM
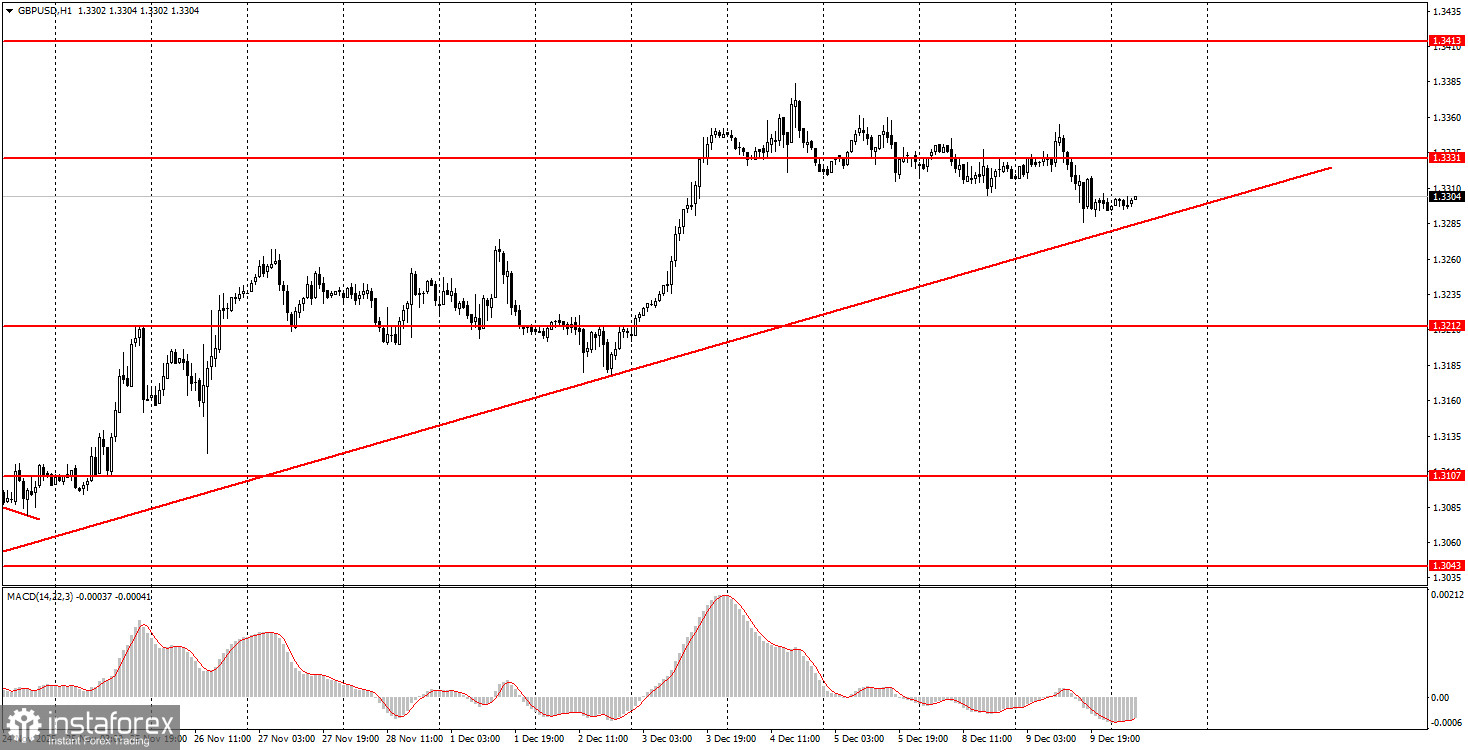
The GBP/USD pair showed no interesting movements on Tuesday, despite the presence of a fundamental and macroeconomic background. Yesterday, the Bank of England Governor Andrew Bailey gave a speech, and the U.S. released the JOLTs and ADP reports. We immediately warned that one should not expect much from U.S. reports, as they either relate to a period no longer relevant or reflect changes over just one week. In fact, the JOLTs reports provided the dollar with some support (as the number of job openings in September and October exceeded forecasts), but we essentially saw the same movements as in the previous few days. Regarding Andrew Bailey's speech, the BoE's head did not announce anything significant. As a result, the pair corrected for the fourth consecutive day within the upward trend, but it has not yet settled below the trend line. Therefore, upward movement may resume, especially with today's FOMC meeting.
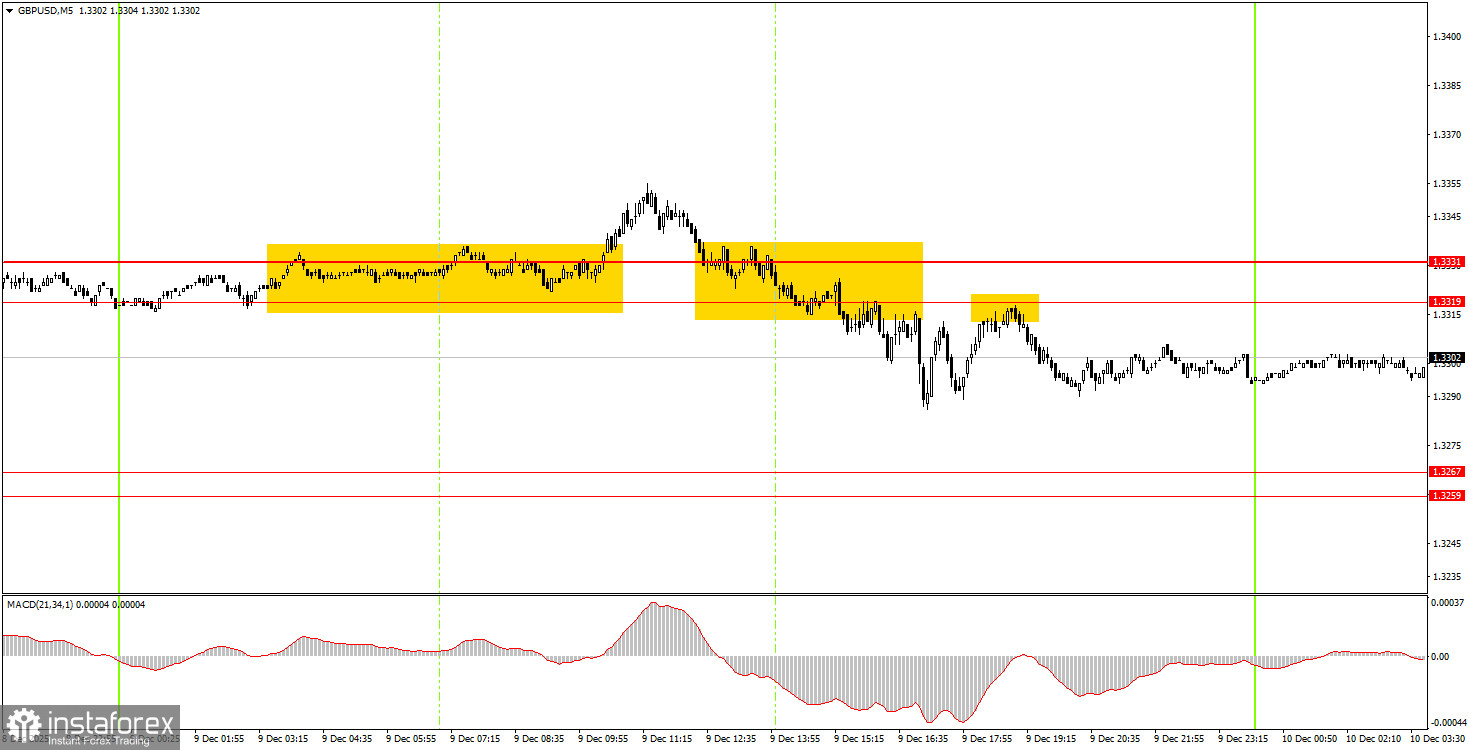
On the 5-minute timeframe, three trading signals were formed on Tuesday. Of course, all three left much to be desired. The signals themselves were fairly decent, but market movements remain very weak. First, the pair settled above the area of 1.3319-1.3331, then below this area, and finally, it bounced from it below. In each of the three cases, the price moved in the needed direction by no more than 20 pips.
On the hourly timeframe, the GBP/USD pair continues to form a local upward trend. As we mentioned earlier, there are no global factors driving medium-term dollar growth; thus, we expect movement only to the upside. The correction/flat on the daily timeframe may not yet be complete, but any local upward trend on the hourly timeframe could signal a resumption of the global trend. The FOMC meeting this week may help establish an upward trend.
On Wednesday, beginner traders may again anticipate the formation of trading signals in the 1.3319-1.3331 range. A settlement above this area will open new long positions with a target at 1.3413. A bounce from it will lead to short positions with a target of 1.3259-1.3267. However, it is important to remember that movements throughout the day may again be very weak, while in the evening, they could be strong and unpredictable.
On the 5-minute timeframe, trading can currently be done at levels 1.2913, 1.2980-1.2993, 1.3043, 1.3096-1.3107, 1.3203-1.3212, 1.3259-1.3267, 1.3319-1.3331, 1.3413-1.3421, 1.3466-1.3475, 1.3529-1.3543, 1.3574-1.3590. On Wednesday, no major events are scheduled in the UK, but the FOMC meeting results will be announced in the U.S. in the evening. Jerome Powell will give a speech, and the dot-plot will be released.
Important Note: Significant speeches and reports (always included in the news calendar) can greatly influence the movement of the currency pair. Therefore, during their release, it is advisable to trade cautiously or exit the market to avoid sharp reversals against the preceding movement.
Remember: For beginners trading in the Forex market, it is important to understand that not every trade can be profitable. Developing a clear strategy and practicing money management are keys to long-term trading success.


