Vea también

 18.12.2025 07:11 AM
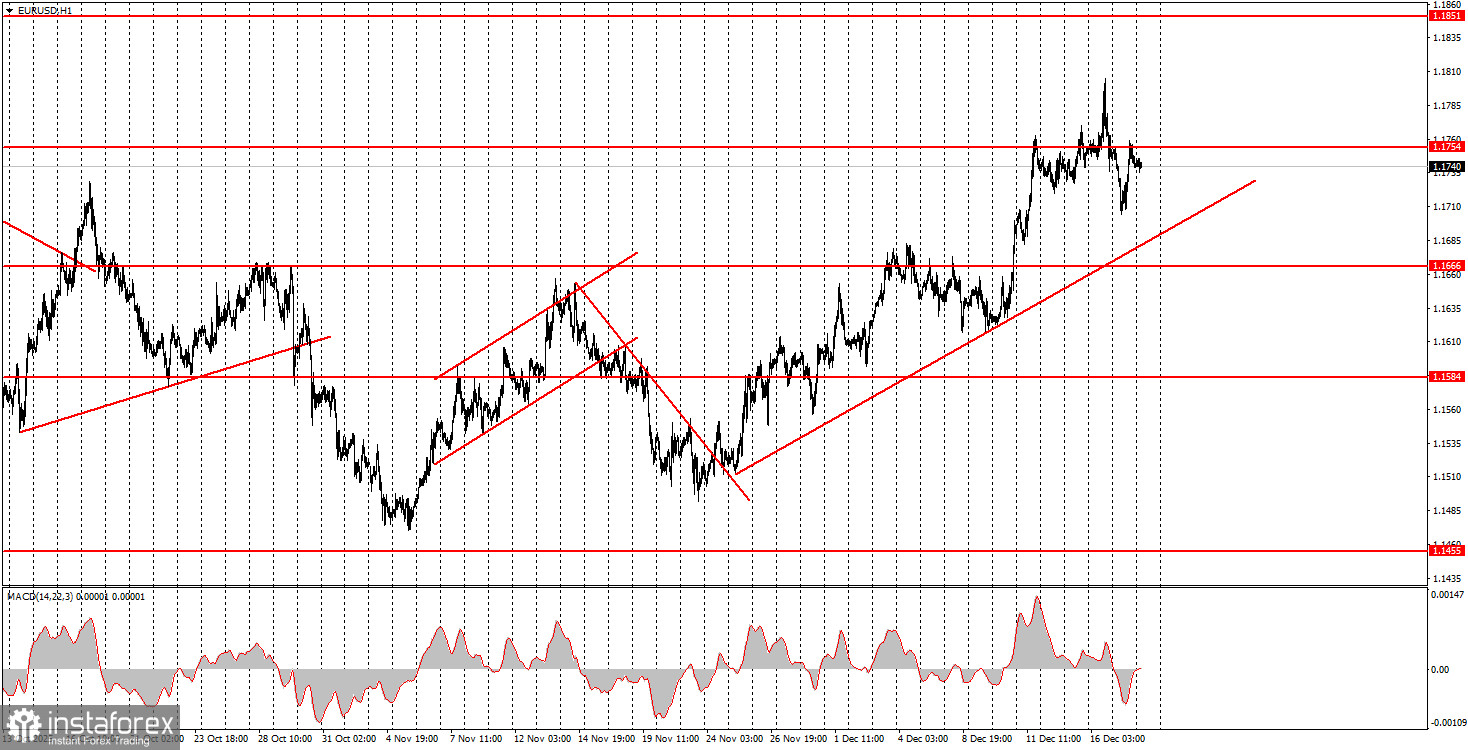
The EUR/USD currency pair corrected downward on Wednesday, but the upward trend remains intact, as clearly shown in the illustration above. Yesterday, the euro declined sharply, despite an essentially absent macroeconomic and fundamental backdrop. Traders might have felt that a downward trend was beginning, which is indeed possible, as the price reached the upper boundary of the sideways channel of 1.1400-1.1830 on the daily timeframe. However, the flat has lasted for six months, and sooner or later, it must come to an end. Thus, we believe it's still too early to panic and expect a new decline in the pair. Growth may continue. Today, an important inflation report from the U.S. is set to be published, which could trigger volatility and weaken the dollar. If inflation begins to slow, it will increase the likelihood of another Federal Reserve rate cut in January. The European Central Bank meeting will also take place, but significant decisions are not expected at this time, although surprises are always possible. The price continues to remain above the trend line, so there are few grounds to expect a decline.
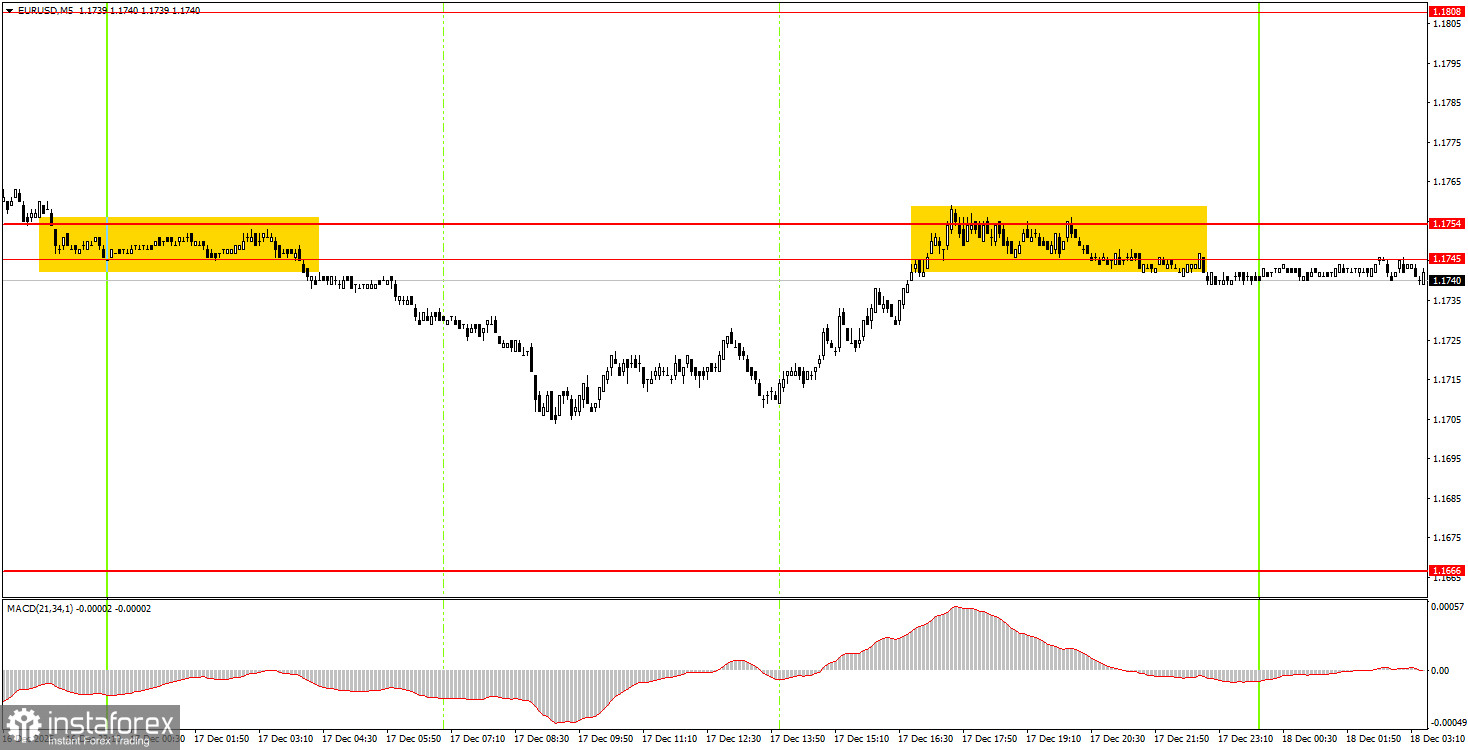
On the 5-minute timeframe, a good sell signal formed on Wednesday night. The price bounced from the 1.1745-1.1754 range, allowing novice traders to open short positions. However, the pair did not reach the target level of 1.1666 and returned to its starting positions by the end of the day. We consider the recovery of the pair in the second half of the day, without any visible reasons, to be a positive sign for the prospects of further growth.
On the hourly timeframe, the EUR/USD pair continues to exhibit an upward trend. The overall fundamental and macroeconomic backdrop remains very weak for the U.S. dollar, so we expect the pair to continue to grow. The price has reached the upper line of the sideways channel of 1.1400-1.1830, so it now needs to either break through it or remain in the flat.
On Thursday, novice traders can again trade from the 1.1745-1.1754 area. A bounce from this area will allow for short positions with targets at 1.1655-1.1666. If the price consolidates above this area, then long positions targeting 1.1808 will become relevant.
On the 5-minute timeframe, consider the levels 1.1354-1.1363, 1.1413, 1.1455-1.1474, 1.1527-1.1531, 1.1550, 1.1584-1.1591, 1.1655-1.1666, 1.1745-1.1754, 1.1808, 1.1851, 1.1908, 1.1970-1.1988. On Thursday, the ECB meeting will take place in the EU, which may have significant repercussions. The Bank of England meeting in the UK could also impact the European currency. In the United States, an important inflation report for November will be published, which is crucial for the Fed's monetary policy. At least three events could provoke substantial movements in the market.
Important Note: Significant speeches and reports (always included in the news calendar) can greatly influence the movement of the currency pair. Therefore, during their release, it is advisable to trade cautiously or exit the market to avoid sharp reversals against the preceding movement.
Remember: For beginners trading in the Forex market, it is important to understand that not every trade can be profitable. Developing a clear strategy and practicing money management are keys to long-term trading success.


