Vea también

 27.01.2026 07:25 AM
Bitcoin is forming a new wave of a descending trend after a sell signal was generated on the daily timeframe. Following the formation of the sell signal on the daily timeframe, at least two sell signals were generated on the 4-hour timeframe. The price has formed "bearish" Fair Value Gaps (FVG) twice and has reacted to them both times. Thus, even on the lower timeframe, the downward movement continues, with no signs of its completion.
On the daily timeframe, the cryptocurrency continues to drop below the ascending trend line, which also serves as a liquidity pool. If we consider this trend line as a trend line, the price has breached it; therefore, according to the principles of technical analysis, the trend has changed to a downward one. If we view this trend line as a liquidity pool, the price had to drop below it to "collect" the stop losses of traders and pending sell orders. Since there are currently no signs that bitcoin's decline is coming to an end, we expect the new wave of the downward trend to target $70,800.
The fundamental background remains unchanged and has no impact on the cryptocurrency market. On Wednesday evening, the Federal Reserve's meeting results will be announced, and many experts continue to discuss Bitcoin's rise if the central bank continues to ease monetary policy. We believe the factor of a lower key interest rate in the US has been priced in since 2022, when inflation began to slow from its peak levels and the market started anticipating a softening of the Fed's policy. In our view, a downward trend is forming and will continue, unlikely to reverse within a few months. All "bullish" factors have already been accounted for by the market.
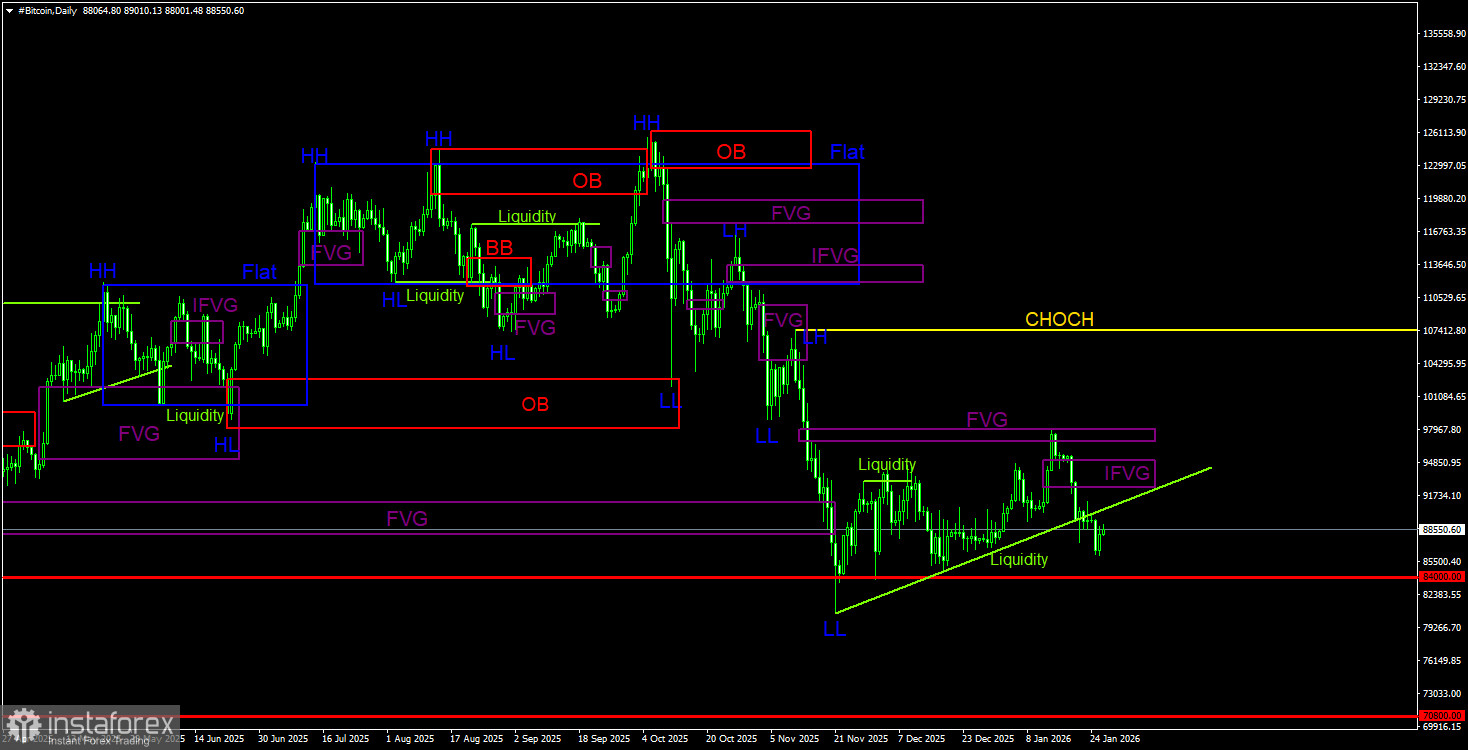
On the daily timeframe, Bitcoin continues to form a downward trend, and the correction may already be over. The trend structure is downward, and the CHOCH (Change of Character) line is currently at $107,300. Only above this level can we say that the downward trend has ended. In 2026, Bitcoin could fall to as low as $60,000, from where its last ascent began. Bitcoin received a significant reaction to the "bearish" FVG; a trading signal has been formed, and confirmation has been obtained, initiating the decline. The target for this new wave of downward movement could be the $70,800 level, which represents 50.0% on the Fibonacci scale. The "bullish" FVG has transformed into a "bearish" IFVG, which is now a new area of interest (POI) for sales.
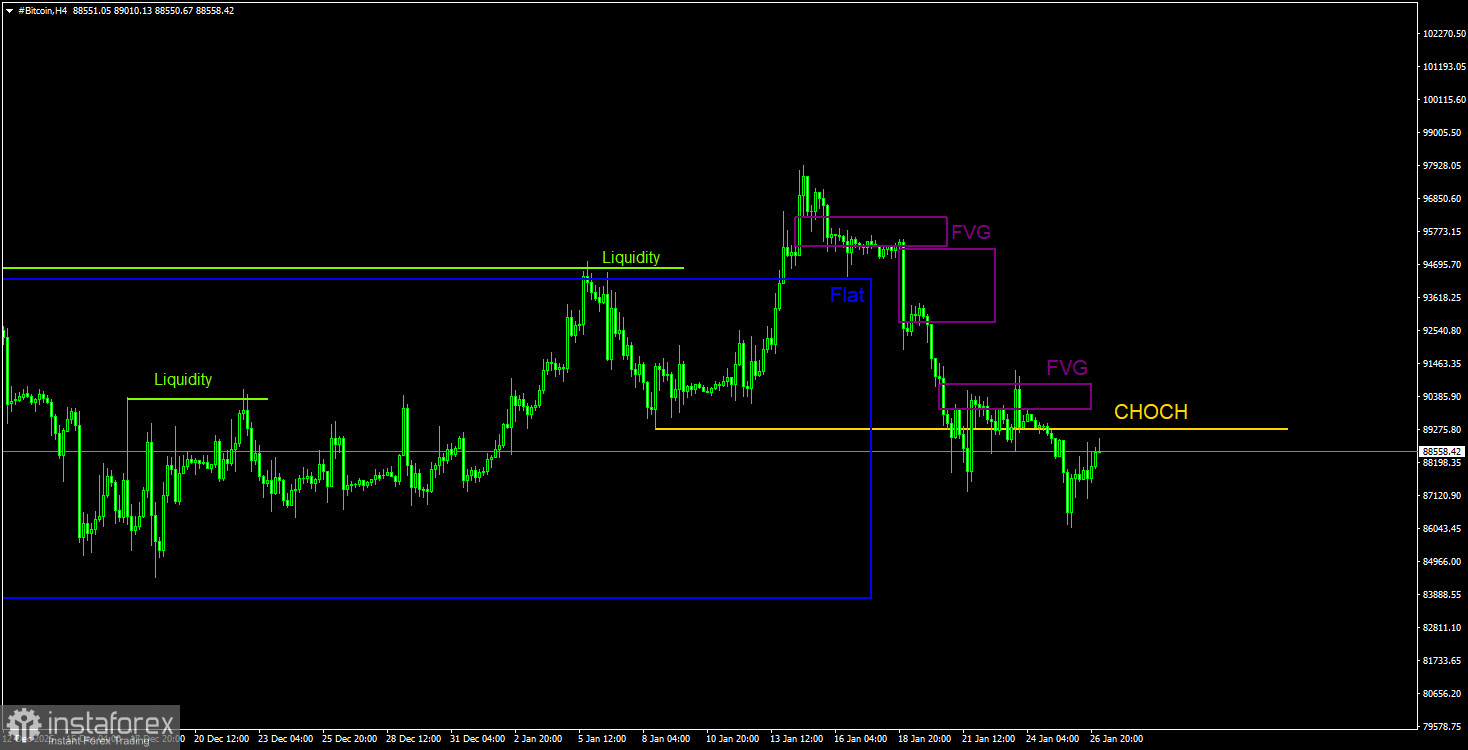
On the 4-hour timeframe, the price has exited the sideways channel it had spent a month and a half in. However, the Bitcoin rally was short-lived as the "bearish" FVG on the daily timeframe halted the upward price movement. The upward structure on the 4-hour timeframe has been broken; over the past few days, two bearish FVGs have formed, each prompting a price reaction. Considering the picture on the daily timeframe, we anticipate that the decline will continue, and all the nearest bearish patterns can be used to open new short positions.
Bitcoin continues to form a full-fledged downward trend. We expect to see a decline toward the $70,800 level (the 50.0% Fibonacci level from a three-year upward trend). New areas of POI for sales on the daily timeframe include the bearish IFVG located in the range of $92,500 – $95,000. The price may return to this pattern and then initiate a further decline. On the 4-hour timeframe, bearish FVGs are forming, from which additional short positions can be opened or used as confirmation of further declines.


