Vea también

 06.04.2026 11:43 AM
The EUR/USD pair continued its decline throughout Friday, but trader activity was practically at zero that day. After the quotes consolidated below the 100.0% Fibonacci level at 1.1577, the decline may continue toward the next corrective level of 127.2% at 1.1440. A consolidation above the 1.1577 level would favor the euro and a resumption of growth toward the 76.4% corrective level at 1.1696.
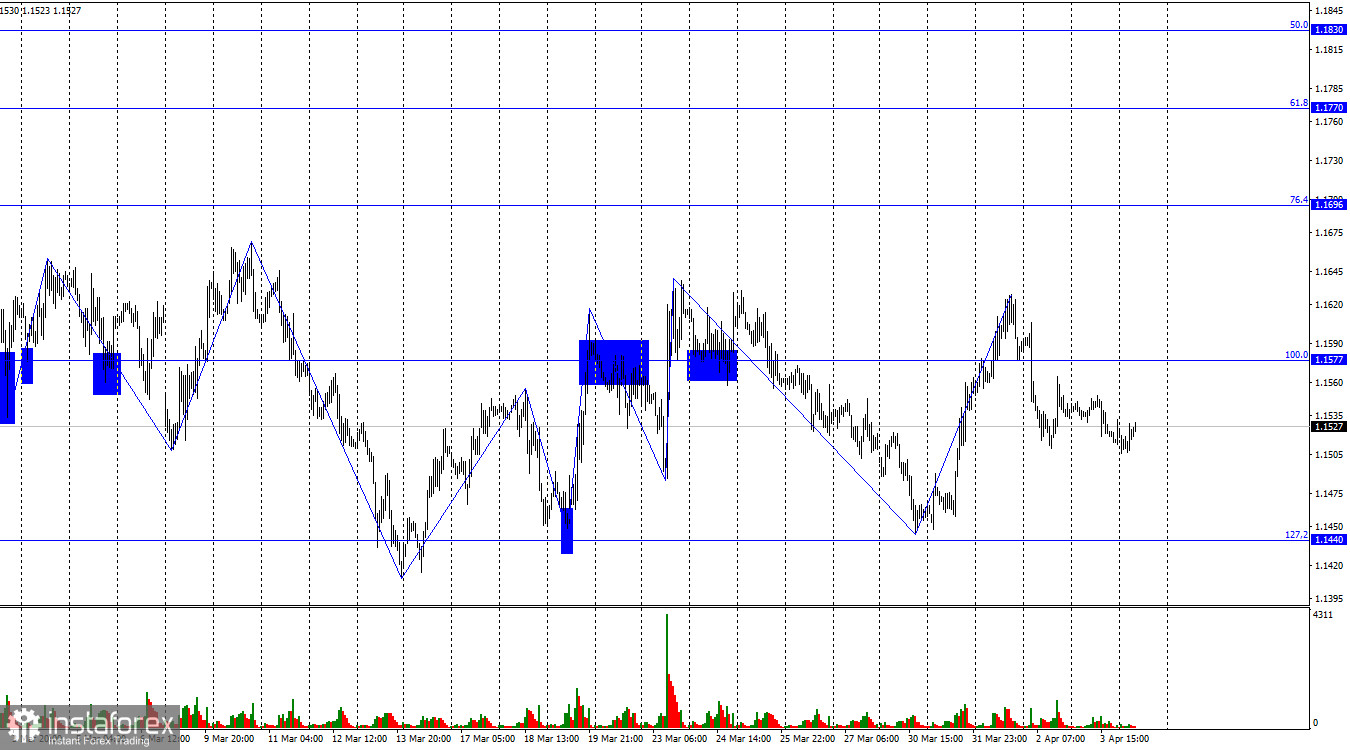
The wave situation on the hourly chart has taken on a rather complex form. All recent waves have formed within approximately the same price range and are roughly equal in size. Thus, it might be best to conclude that a sideways market is present. In my opinion, this is not exactly a sideways market. Rather, these are erratic movements formed as a result of constantly changing geopolitical conditions. At the moment, traders do not understand what to expect next in the Middle East.
On Friday, the news background gave bears the opportunity to continue their offensive, which had faded in recent weeks. At present, it is clear that the worst-case scenario in the Middle East has already been priced in by traders, and new factors are needed for further decline. On Friday, such factors appeared. The Nonfarm Payrolls report showed the creation of nearly 180,000 jobs, far exceeding more modest forecasts. The unemployment rate fell to 4.3%, while traders had expected 4.4%. Thus, the US dollar had every chance to continue rising on Friday, but traders once again did not consider economic statistics an important event. It is worth recalling that in recent weeks, economic data has rarely been taken into account by traders. Most attention remains focused on geopolitics. Friday made it clear that the situation in the currency market has not changed—traders are still tracking only geopolitics. Therefore, in the absence of escalation in the Middle East, a sideways movement may continue this week.
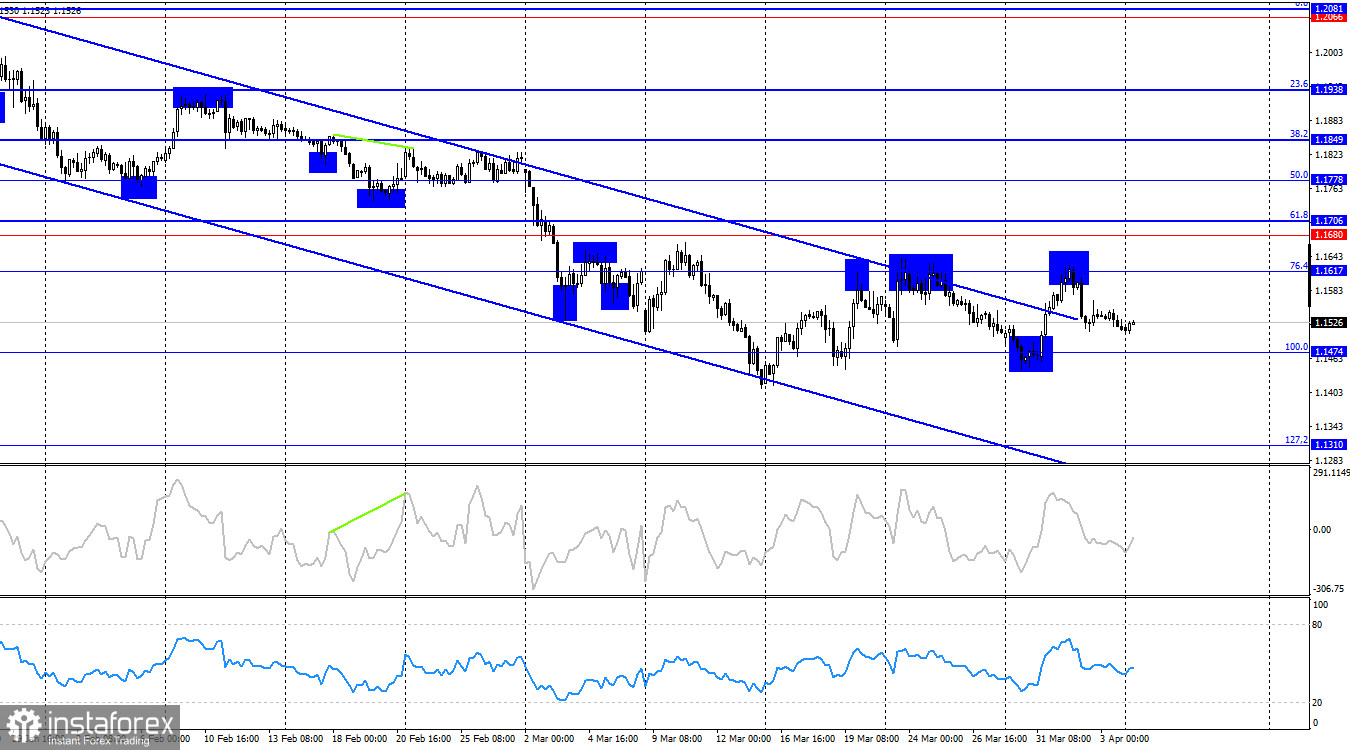
On the 4-hour chart, the pair rose to the 100.0% corrective level at 1.1474, rebounded from it, and reversed in favor of the US dollar. Thus, the decline may continue toward the 100.0% Fibonacci level at 1.1474. Earlier, the pair closed above the descending trend channel, which slightly improves the outlook for bulls compared to bears. However, geopolitics remains the decisive factor. No emerging divergences are observed in any indicators.
Commitments of Traders (COT) report:
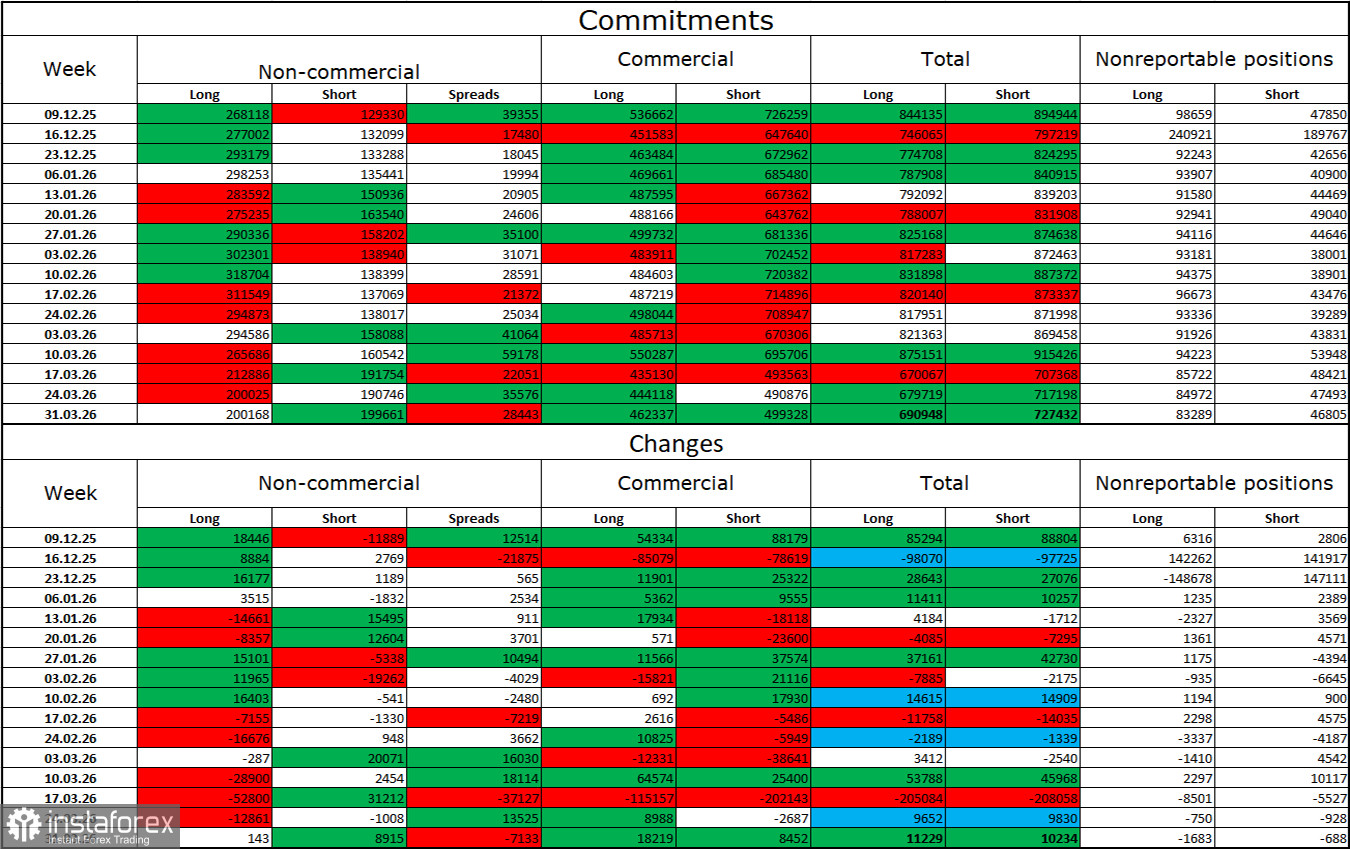
During the latest reporting week, professional traders opened 143 long positions and 8,915 short positions. Thus, in just seven weeks, the bulls' total advantage has evaporated. The total number of long positions held by speculators now stands at 200,000, while short positions total 199,000. Two months ago, bulls held more than a twofold advantage among non-commercial traders.
Overall, in the long term, large players continue to view the euro with significant interest. Of course, various global events—of which there has been no shortage in recent years—affect investor sentiment. In particular, the market's attention is currently focused on the Middle East, where the conflict continues to intensify and expand geographically. Therefore, in the near term, the euro and dollar exchange rate will depend not on the monetary policies of the Federal Reserve or the ECB, nor on economic data, but on the war in Iran. And for now, the dollar is extracting maximum benefit from this situation.
News calendar for the US and the Eurozone:
The April 6 economic calendar contains one fairly important entry. The impact of the news background on market sentiment may be felt in the second half of Monday, unless traders ignore this report as well.
EUR/USD forecast and trading tips:
Selling the pair was possible after a close below the 1.1577 level on the hourly chart, targeting 1.1440. These positions can still be held. Buy trades will become possible if the price consolidates above 1.1577, targeting 1.1696.
Fibonacci levels are drawn from 1.1577–1.2082 on the hourly chart and from 1.1474–1.2082 on the 4-hour chart.


