আরও দেখুন

 21.11.2025 11:25 AM
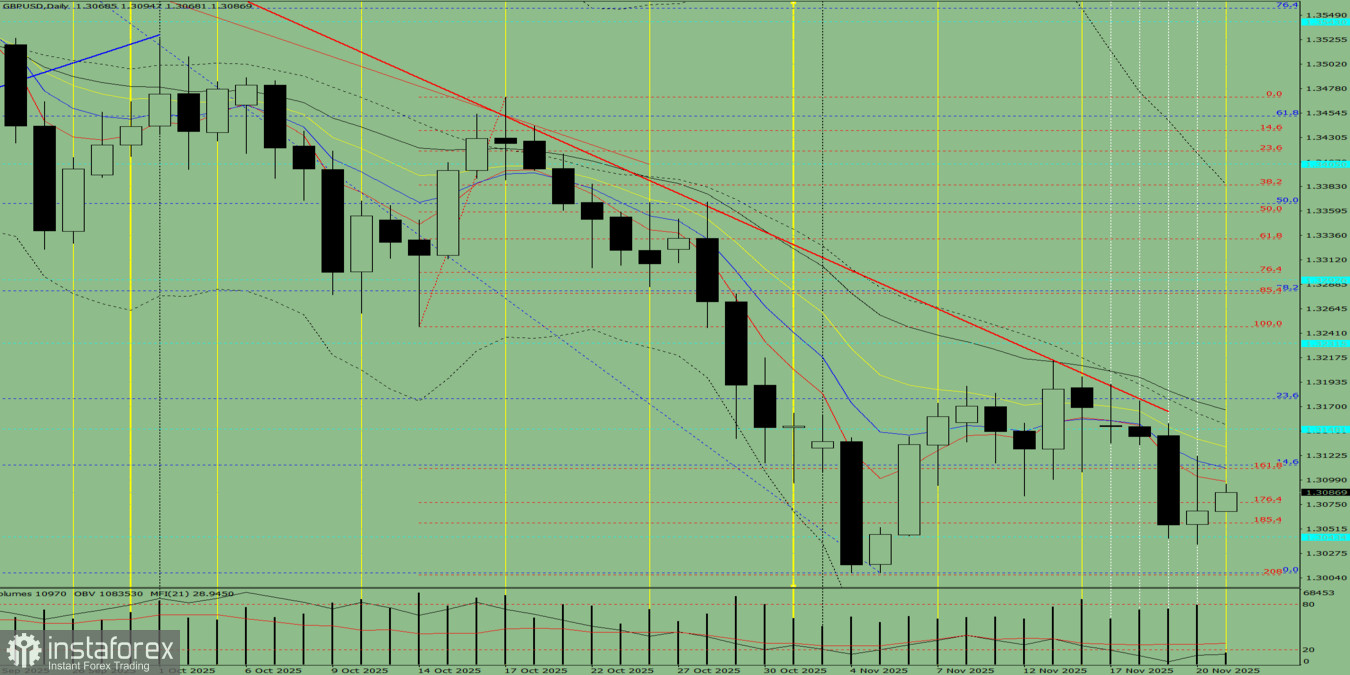
Fig. 1 (daily chart).
Comprehensive Analysis:
Alternative scenario:From the level of 1.3069 (yesterday's daily candle close), the price may begin moving upward with a target of 1.3148 – a historical resistance level (blue dashed line). When testing this level, a downward pullback movement is possible with a target of 1.3113 – the 14.6% pullback level (blue dashed line).
You have already liked this post today
*এখানে পোস্ট করা মার্কেট বিশ্লেষণ আপনার সচেতনতা বৃদ্ধির জন্য প্রদান করা হয়, ট্রেড করার নির্দেশনা প্রদানের জন্য প্রদান করা হয় না।


