यह भी देखें

 21.11.2025 11:25 AM
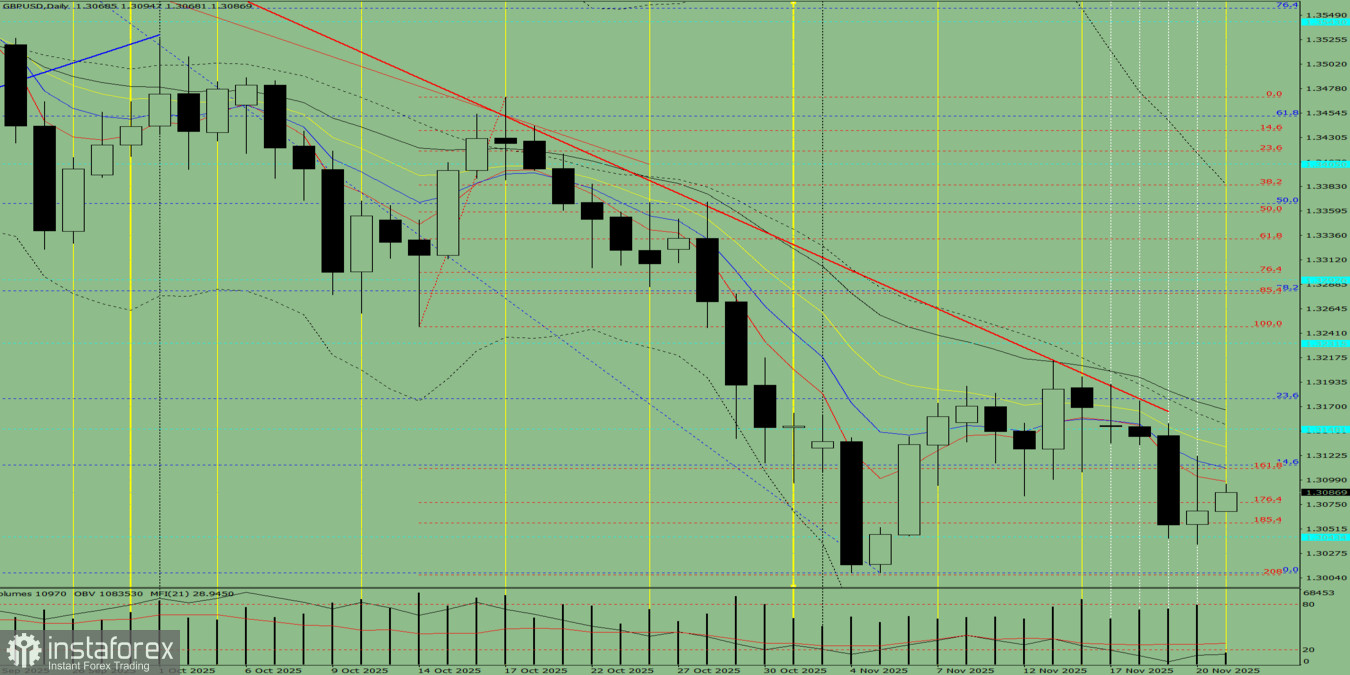
Fig. 1 (daily chart).
Comprehensive Analysis:
Alternative scenario:From the level of 1.3069 (yesterday's daily candle close), the price may begin moving upward with a target of 1.3148 – a historical resistance level (blue dashed line). When testing this level, a downward pullback movement is possible with a target of 1.3113 – the 14.6% pullback level (blue dashed line).
You have already liked this post today
*यहां पर लिखा गया बाजार विश्लेषण आपकी जागरूकता बढ़ाने के लिए किया है, लेकिन व्यापार करने के लिए निर्देश देने के लिए नहीं |

