Veja também

 20.11.2025 10:29 PM
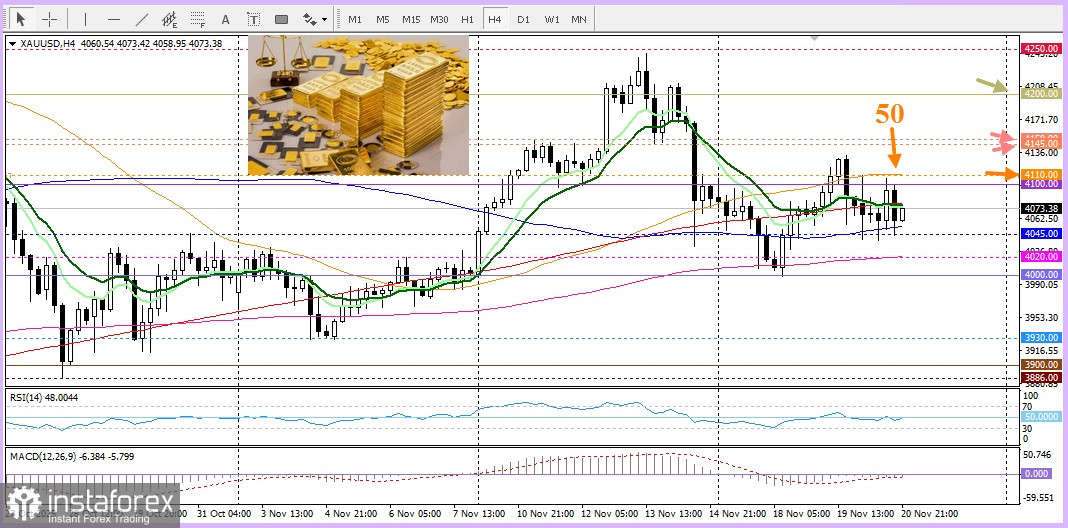
Today, gold is trading within its familiar four-day range, finding support at the 100-period Simple Moving Average (SMA) on the 4-hour chart. From a technical standpoint, any decline is likely to find solid support near the 200-period Exponential Moving Average (EMA), which currently lies around $4020. Next comes the weekly low, slightly below the psychological level of $4000; a break beneath this level would accelerate the decline toward support at $3930. The downward trajectory may continue toward a test of the late-October low near $3886.
On the other hand, the 50-period Simple Moving Average (SMA) on the 4-hour chart, located around $4110, is the nearest resistance. A modest rise above this level would be perceived as a new bullish catalyst, lifting the price of the yellow metal to the next resistance zone around $4150–4145. Further growth would pave the way toward the next psychological level at $4200.
You have already liked this post today
*A análise de mercado aqui postada destina-se a aumentar o seu conhecimento, mas não dar instruções para fazer uma negociação.


