Veja também

 02.02.2026 12:55 AM
Bitcoin, along with Ethereum, is experiencing another decline. The entire cryptocurrency market is also falling. What are the reasons for Bitcoin depreciating nearly 40% or $50,000 in just four months? Firstly, we want to remind traders of two things. No upward trend lasts forever. Even this rule has exceptions, but in most cases, it holds true. We might still believe that gold will always increase in value (though that is unlikely), but Bitcoin is not gold and has no physical value. Secondly, every upward trend in Bitcoin has ended with a decline of 70-80%. Therefore, from our perspective, all of this is entirely predictable.
Meanwhile, experts are slowly starting to sound the alarm. Of course, there are still those "experts" who continue to predict insane growth for Bitcoin "in the near future," but we have already discussed how to approach such forecasts. Experts note that in recent months, amid the dollar's decline, global uncertainty, and geopolitical tensions, more investors are choosing tried-and-true safe assets: gold, silver, and stocks.
Previously, there was a theory that Bitcoin should appreciate when the US dollar falls, protecting savings from inflation. Now everyone can see how effective this theory is. There was a common belief in a strong correlation between Bitcoin and gold, or between Bitcoin and US stock indices. Now everyone can confirm how true this is. In our opinion, most "experts" exhibit the "Texas sharpshooter syndrome." There is a legend that in Texas, a farmer shot a gun at the barn wall and then painted targets where he hit most often. This is somewhat analogous to the cryptocurrency market. When Bitcoin rises, there will immediately be a multitude of reasons "why," along with many correlations. In reality, Bitcoin has always traded according to its own rules.
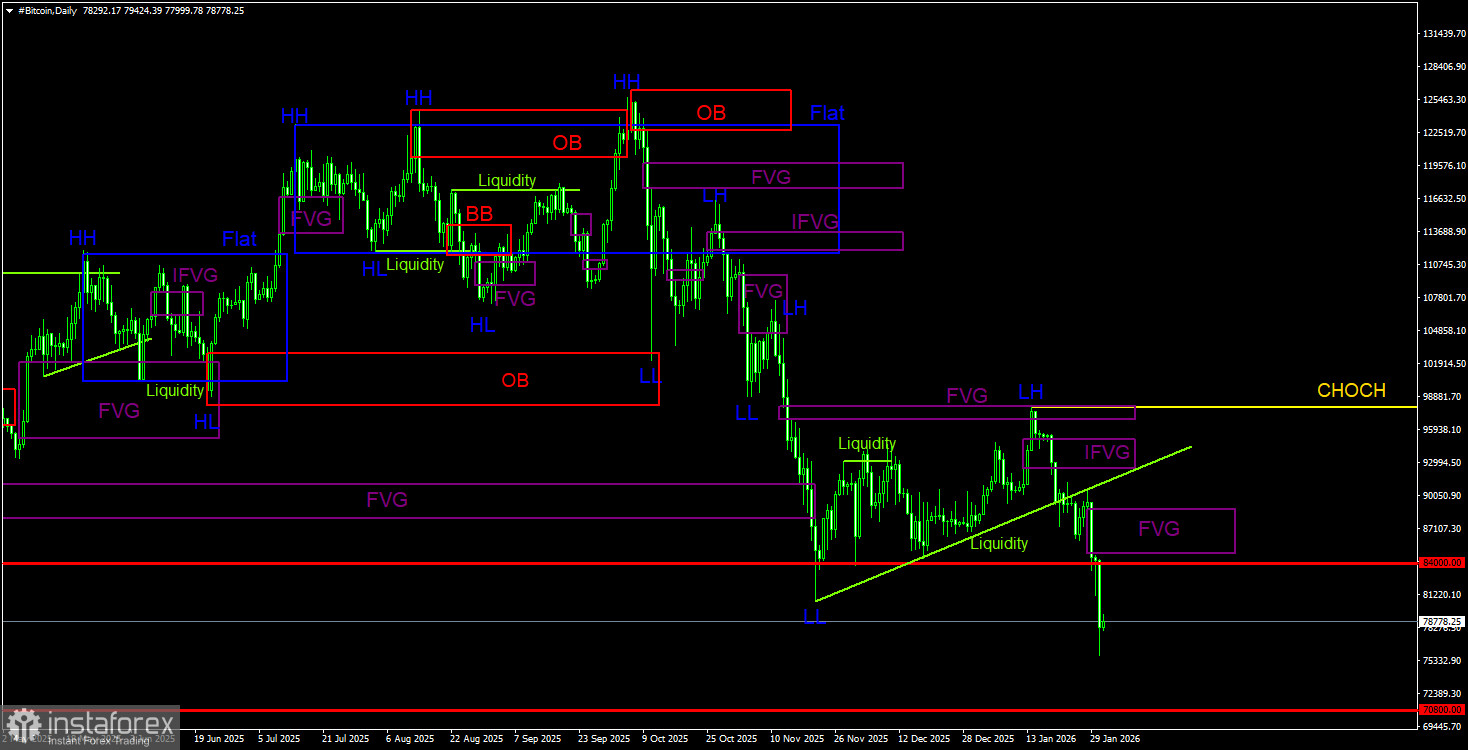
Bitcoin continues to form a whole downward trend. We still expect a decline to $70,800 (the 50.0% Fibonacci level of the three-year upward trend), and there are no signs of a trend reversal or correction. Among the POI areas for selling on the daily timeframe, we can highlight the "bearish" IFVG and "bearish" FVG. On the 4-hour timeframe, two "bearish" FVGs have also formed, which may provide opportunities for opening new shorts. However, a correction should be considered in the near future.
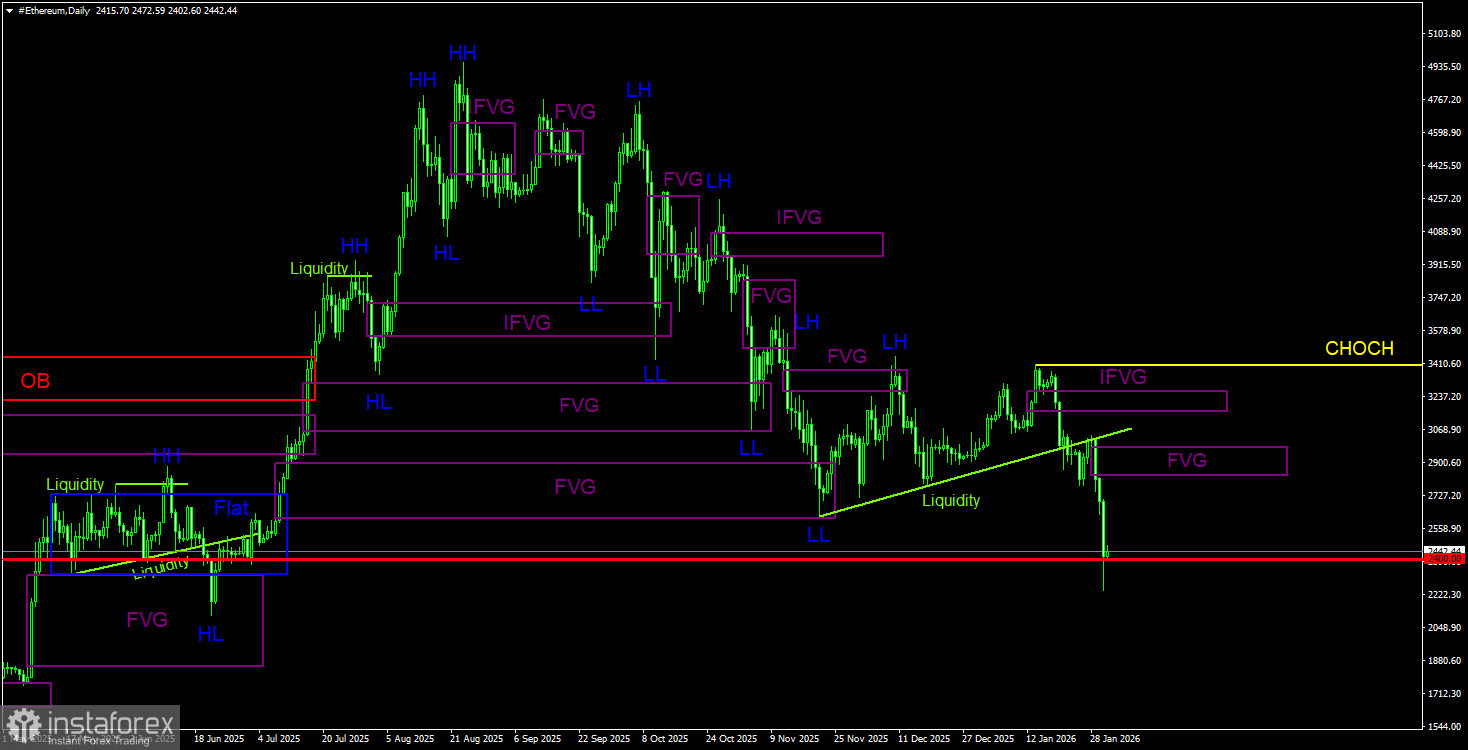
The daily timeframe continues to indicate a downward trend. The key pattern for selling has been and still is the "bearish" order block on the weekly timeframe. The movement triggered by this signal should be strong and long-lasting. On the daily timeframe for Ethereum, there are two "bearish" FVGs, and on the 4-hour timeframe, there are also two "bearish" FVGs. Traders can consider opening new short positions based on these two patterns. The most important patterns are the nearest ones. All targets we highlighted have been reached. Now, Ethereum's decline targets are down to $1,370, the level where the last upward trend began.
Explanations for Illustrations:


