
Veja também


 02.09.2026 12:40 AM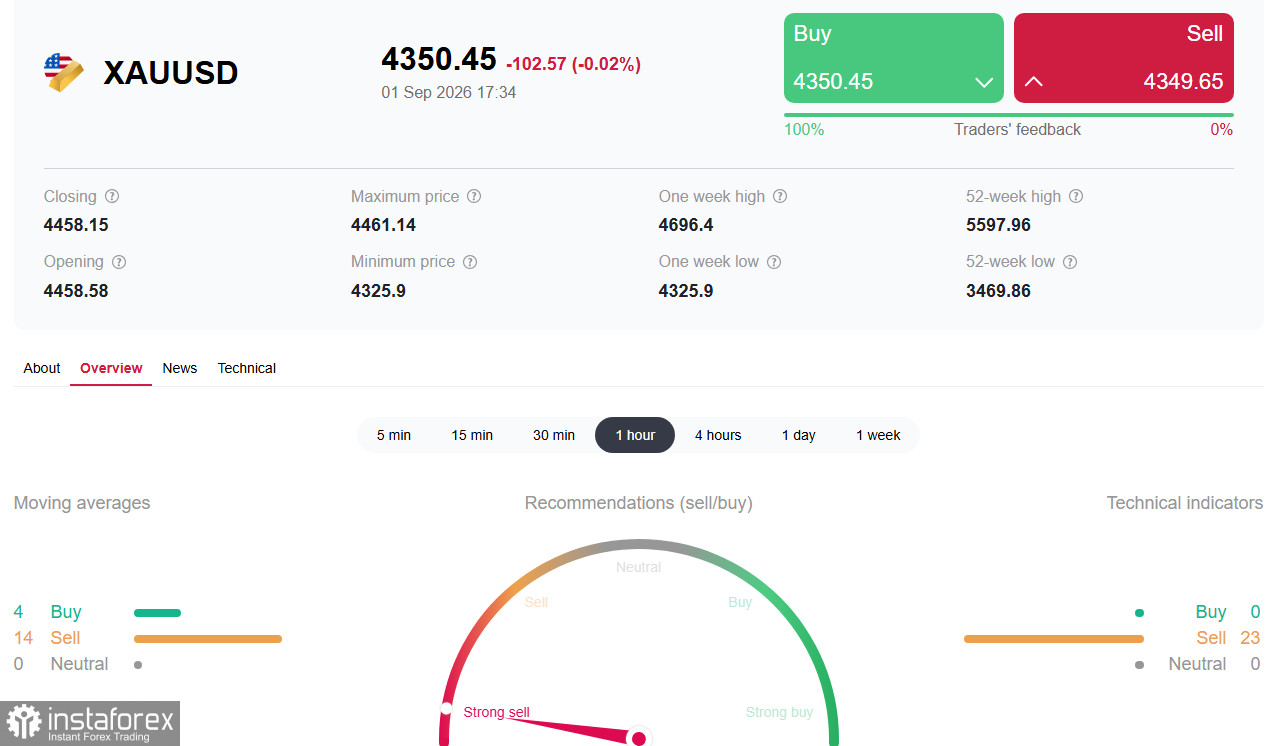
Hawkish Shift from the Fed Puts Significant Pressure on Gold. The primary reason for gold's decline has been comments from Kevin Warsh at the Jackson Hole symposium on Friday. He indicated that the central bank may need to continue raising rates if there is no confidence in a sustainable return of inflation to the target level of 2%. Markets reacted immediately: the probability of a rate hike at the FOMC meeting on September 15-16 surged to about 65-66% from around 40% just a week earlier. This led to a rise in 10-year Treasury bond yields to their highest levels since January 2025 and a strengthening of the U.S. dollar index.
Inflation Risks from Oil. The resumption of military actions between the U.S. and Iran in the Strait of Hormuz has pushed oil prices higher, exacerbating inflationary concerns. In the current market environment, this is viewed as a factor that strengthens the Fed's arguments for tightening policy, adding pressure on non-yielding gold. The rise in oil prices outweighs the traditional demand for gold as a safe haven.
Structural Support from Demand. Despite the short-term pressure, Goldman Sachs and Wells Fargo reaffirm their positive forecasts, expecting prices to rise to 4900.00 by the end of 2026. They attribute this to the ongoing purchases of gold by central banks, diversification of reserves, and steady demand from Asian investors. Wells Fargo also points out that these factors create a "floor" for prices, despite cyclical obstacles.
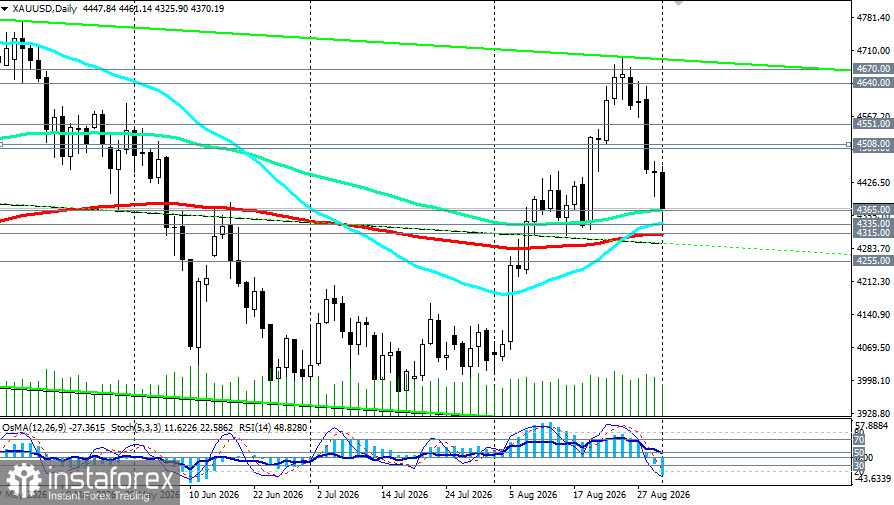
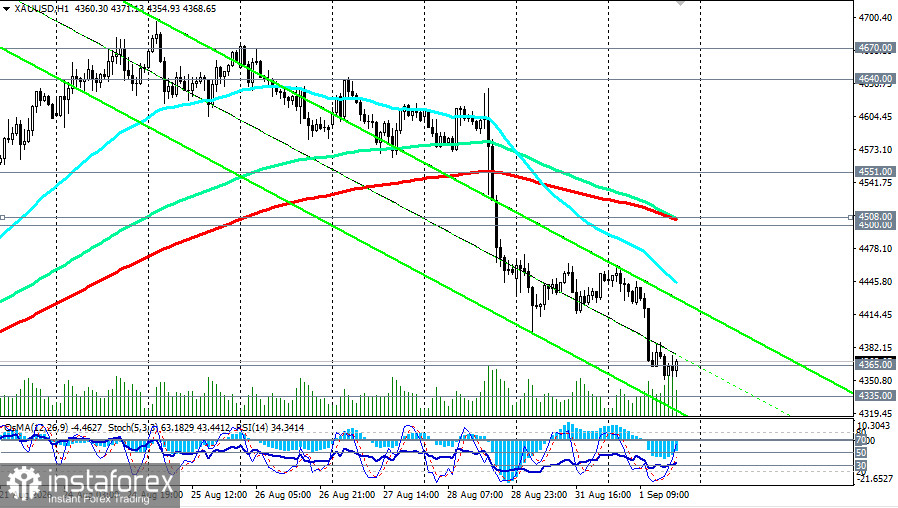
The technical picture remains predominantly bearish. The price is consolidating near a key support zone, and at the time of publication, indicators signal "Strong Sell." However, the price remains above key moving averages (50-, 144-, and 200-day), preserving the potential for a resumption of growth.
| Date | Event | Expected Impact on XAU/USD |
|---|---|---|
Sep 2 | ADP Employment Change | Precursor to NFP; strong data will amplify hawkish expectations |
Sep 4 | NFP Employment Report | KEY EVENT. Strong data may trigger further declines |
Sep 11 | U.S. CPI Data | Decisive factor for the Fed. High inflation will increase pressure |
Sep 15-16 | FOMC Meeting | Rate hike = significant pressure on XAU/USD |
Gold is undergoing a serious correction after the August rally, driven by a sharp change in expectations regarding the Fed's rate. Pressure on the metal remains high, and key labor market and inflation data this week will be decisive in determining XAU/USD's near-term trajectory.
Trading from current levels is risky. The preferred scenario is to sell on a breakdown below support at $4,365.00 with targets at $4,295.00-$4,300.00 and a stop-loss above $4,400.00.
Short positions can be opened upon a breakdown at $4,350.00 with targets at $4,315.00 and $4,300.00.
Long positions may only be considered in the event of recovery and consolidation above $4,400.00, targeting $4,450.00 and $4,500.00.
Potential declines toward the $ 4,200.00–$ 4,250.00 zone can be used for careful accumulation of long positions.
Wells Fargo and Goldman Sachs still see potential for growth to $4,900.00–$5,100.00 by the end of 2026.
Be aware of increased volatility leading up to the publication of NFP and CPI data.
Strictly adhere to stop-losses, especially when trading in oversold zones.
Monitor geopolitical situations — unexpected escalations can trigger sharp reversals.


